Download
1 / 78
780 likes | 995 Views
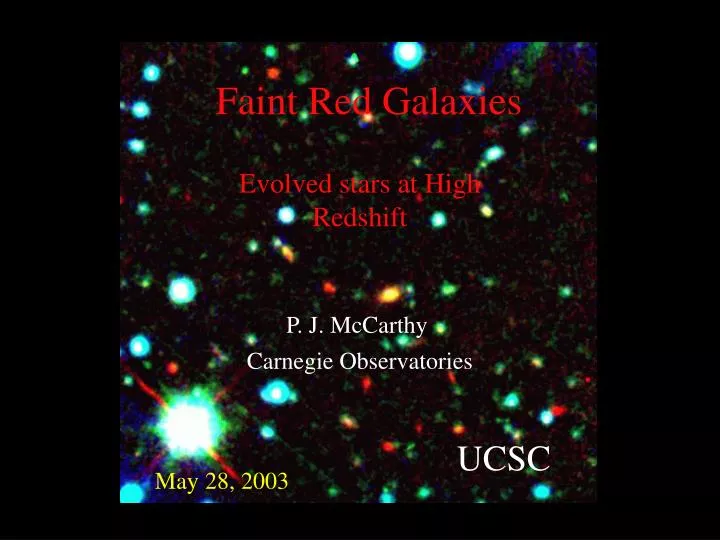
Faint Red Galaxies. Evolved stars at High Redshift. P. J. McCarthy. Carnegie Observatories. UCSC. May 28, 2003. Distant Galaxy Studies in the 20 th Century. Focused on faint blue galaxies Samples UV bright populations Traces heavy element production

E N D
Faint Red Galaxies Evolved stars at High Redshift P. J. McCarthy Carnegie Observatories UCSC May 28, 2003
Distant Galaxy Studies in the 20th Century • Focused on faint blue galaxies • Samples UV bright populations • Traces heavy element production • Global census of conversion of gas into stars Evolution of UV luminosity density Madau et al Steidel et al 99
Faint Galaxies in the Near Infrared • Sensitive to assembly of galaxies via mergers • Near-IR offers a window on mass evolution • Dust not (as) important Build-up of stellar mass over cosmic time Near-IR luminosity provides proxy for stellar mass Near IR-surveys are technically challenging
Optical and near-IR Detectors Large formats: 2k x 4k 3 edge buttable 100 Mpixel FPAs common Cheap - $ 0.01 per pixel 2k x 2k maximum Non-buttable Expensive $ 0.13 per pixel !
Challenges facing Deep near-IR Surveys • Detectors small and Expensive • Cryogenic Optics & baffles required • Sky 3 orders of magnitude brighter! • Can’t observe when the moon is down!
Earliest IR Surveys – New Red population Elston, Rieke & Rieke 1989 10 sq .arcminutes Hu & Ridgeway 1992 100 sq. arcminutes
Some EROs are Sub-mm sources Dey et al. 1999 Smail et al. 1999
Two Red populations? Moderately red, high surface density on sky Z ~ 1 early types Extreme red colors, very rare Z > 1 Starbursts
Las Campanas IR Survey PHASE I: A Carnegie-Cambridge-Toronto Collaboration PHASE II: A Diversified Conglomerate McCarthy, Persson, Martini, Koviak (OCIW) Chen (MIT), Marzke(SFSU), Carlberg, Abraham(UT) Ellis (Caltech), Firth, McMahon, Lahav (IoA)
GOALS • Galaxy Assembly in the 1 < z < 2 Epoch • Space density of massive galaxies • Stellar evolution in early type galaxies • Evolution of 3-D Clustering • Growth of massive galaxies and structure
Why Select in the near-IR? Z = 1.5 V I H K • Selects on basis of population with high M/L • Optical-IR color indices excellent for foreground rejection • That where the light is!
Approach • Multi-color optical & near-IR imaging survey • Depths keyed to z = 2 elliptical: Ks ~ 21 ! • Photometric redshifts • Six fields around the celestial sphere • 1 square degree Color-Mag Diagrams Color-Redshift Diagrams Number Counts Color-Color Diagrams Luminosity Functions Angular Clustering Morphologies Spectroscopy
Reality Intrudes! • Phase I: 1 square degree to H = 20.5 + VRI • Phase II: 1 square degree to K = 20.8 + BVRIz’JH • VRIH survey completed in spring 2001 • 0.75 square degrees J & K in hand • ~10,000 K-selected objects • ~70,000 photometric redshifts • ~ 350 spectroscopic redshifts
CIRSI + LCO Wide Field IR Camera du Pont 2.5m telescope 4 1024 x 1024 arrays cryogenic Offner relay 16 channel electronics
100,000 1024 x 1024 Frames - 30 seconds each 13’ x 13’ mosaic – 3 hour exposure
Red Galaxies are Abundant V,I,K 80”
Photometric Redshifts • 8 color photometery BVRIz’JHKs • 6 Galaxy templates • 1 AGN, 128 stellar templates See Koo 1985 Connolly et al 1995,1997 Best fit template and redshift Likelihood function
Photometric Redshifts from LCIR Chen et al 2002
Photometric Redshifts from LCIR Recent update GMOS redshifts
Basic Phenomenology: Sky density, Space Density, Luminosity & Color Evolution
IR to Optical Color Selection I-K > 4 Rejects z < 1 Foreground & late types at all redshifts
IR to Optical Color Selection I-K > 4 Rejects z < 1 Foreground & late types at all redshifts
Color-Magnitude Diagram Stars 0.0 < z < 1.0 1.0 < z < 1.5 1.5 < z < 2.0 2700 sq. arcmin
Number-Magnitude Relations I-K > 4.0 I-K > 4.5 I-K > 5.0
Number-Magnitude Relations I-K > 4.0 I-K > 4.5 I-K > 5.0 Gardner et al K-band LF
UV & Optical Color Diagnostics Z = 1.5 V I H K Optical to IR color sensitive to old population I-K Rest-frame UV slope sensitive to recent star formation V-I
Color-Color Diagrams • Stars form distinct sequence K < 17.5
Color-Color Diagrams • Stars form distinct sequence K < 18.5
Color-Color Diagrams • Stars form distinct sequence • Z > 1 galaxies appear at K ~ 19 K < 19.5
Color-Color Diagrams • Stars form distinct sequence • Z > 1 galaxies appear at K ~ 19 • Z > 1.5 galaxies at K ~ 20 K < 20.8
Color-Color Diagrams • Stars form distinct sequence • Z > 1 galaxies appear at K ~ 19 • Z > 1.5 galaxies at K ~ 20 • Reddest galaxies follow minimal evolution track K < 20.8
Evolving Luminosity Functions Luminosity functions from photometric redshifts Redshift errors must be explicitly treated! Chen et al. 2002
Evolving Luminosity Functions • LFs derived from photo-z’s with modified likelihood approach • LF at intermediate z agrees well with CNOC2 • Very little apparent evolution in L* to z ~ 1.2 Chen et al. 2002
R-band Luminosity Density Rest-Frame R-band Luminosity density little or no evolution to z ~ 1.2
Clustering: A proxy for merging Tags populations at high and low redshift
Angular Clustering Clustering amplitude of red galaxies is 20 x that of the full field
Angular Clustering q = 12” I – K > 4 q = 1” All K < 20.5
Angular Clustering • Clustering amplitude higher for redder colors and brighter magnitudes. • = 30” K ~ 18 & I-K > 5 n(z) required for r_0
Inversion of w(q) to r0 Generalized Limber equation: q = 2 All I-K K > 19 <z> 0.7 q = 5 I-K > 4 19 < K < 20 <z> 1.0 q = 15 I-K > 4 18 < K < 19 <z> 1.0 q = 10’’ I-K > 5 18 < K < 20 <z> 1.2
Inversion of w(q) to r0 Generalized Limber equation: q = 2 All I-K K > 19 <z> 0.7 5 h-1Mpc q = 5 I-K > 4 19 < K < 20 <z> 1.0 9 q = 15 I-K > 4 18 < K < 19 <z> 1.0 9 q = 10’’ I-K > 5 18 < K < 20 <z> 1.2 10
Evolution and Color Dependence Red color selection or E morphological selection Blue color selection or late type morphological selection LCRS CNOC2 CFRS CFGRS LBG