
Uploaded by
tricia
1 SLIDES
80 VIEWS
10LIKES
Sample-to-Sample Variation in Number of OTUs Identified at 95%
DESCRIPTION
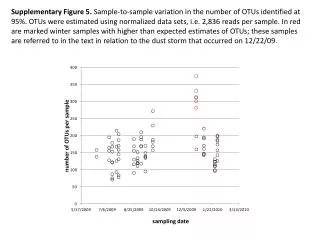
Supplementary Figure 5 showcasing the variation in OTU estimates with normalized data sets for a sampling date with unexpected high OTU estimates in winter samples after a dust storm on 12/22/09.
Download
1 / 1
Download Presentation 
Sample-to-Sample Variation in Number of OTUs Identified at 95%
An Image/Link below is provided (as is) to download presentation
Download Policy: Content on the Website is provided to you AS IS for your information and personal use and may not be sold / licensed / shared on other websites without getting consent from its author.
Content is provided to you AS IS for your information and personal use only.
Download presentation by click this link.
While downloading, if for some reason you are not able to download a presentation, the publisher may have deleted the file from their server.
During download, if you can't get a presentation, the file might be deleted by the publisher.
E N D
Presentation Transcript
Supplementary Figure 5. Sample-to-sample variation in the number of OTUs identified at 95%. OTUs were estimated using normalized data sets, i.e. 2,836 reads per sample. In red are marked winter samples with higher than expected estimates of OTUs; these samples are referred to in the text in relation to the dust storm that occurred on 12/22/09. number of OTUs per sample sampling date


More Related