Soil Permeability Experiment Results Analysis
20 likes | 105 Views
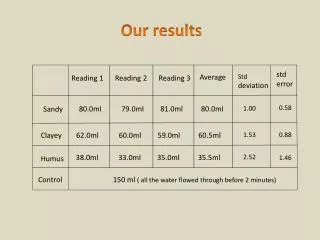
Analyzing the effect of different soil types on water flow rates during a permeability experiment. Results show variability in flow rates through sandy, clayey, and humus soils compared to control. Data includes average flow rates and standard deviations for multiple readings.

Soil Permeability Experiment Results Analysis
E N D
Presentation Transcript
Our results std error Average Std deviation Reading 1 Reading 2 Reading 3 0.58 80.0ml 79.0ml 81.0ml 80.0ml 1.00 Sandy Clayey 62.0ml 60.0ml 59.0ml 60.5ml 1.53 0.88 38.0ml 33.0ml 35.0ml 35.5ml 2.52 1.46 Humus 150 ml ( all the water flowed through before 2 minutes) Control
LEGEND - Humus - Clayey soil - Sandy soil Graph 150ml 140ml 150ml 130ml 120ml - Control 100ml 110ml 90ml 81ml 80ml 79ml 80ml 80ml 70ml 62ml 60ml 60.5ml 59ml 60ml 50ml 38ml 35.5ml 40ml 33ml 35ml 30 ml 20 ml 10 ml 0 1st attempt average 3rd attempt 2nd attempt