Download
1 / 30
300 likes | 356 Views
Section 2.1. Overview Types of NL Models Inelastic Model Attributes Energy Dissipation and Damping Gravity Loading Acceptance Limit States. Notes for PEER-SCEC TBI Meeting. Greg Deierlein Stanford University January 17, 2008. 2.1 NL Analysis & Behavioral Effects. IDEALLY

E N D
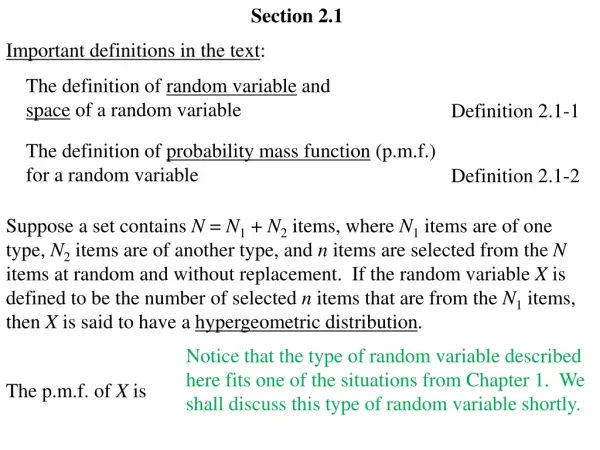
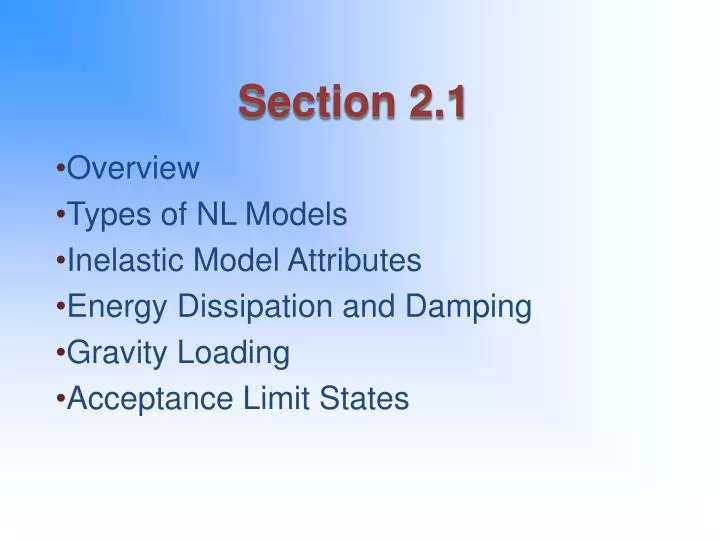
Section 2.1 Overview Types of NL Models Inelastic Model Attributes Energy Dissipation and Damping Gravity Loading Acceptance Limit States
Notes for PEER-SCEC TBI Meeting Greg Deierlein Stanford University January 17, 2008
2.1 NL Analysis & Behavioral Effects • IDEALLY • - NL analysis simulates directly ALL significant modes of deformation & deterioration • PRACTICAL REALITY • Some behavioral effects are simulated directly • Other effects are not simulated and are checked using appropriate limit state criteria • GENERAL MODELING GUIDELINES • Specify model parameters based on AVERAGE (MEAN) properties • Specification of acceptance criteria will depend on how uncertainties are considered elsewhere in the analysis/assessment method • e.g., Should check of wall shear strength be based on “median”, “average”, or “median + sigma” shear force demands? What should be the corresponding capacity (“average” or “expected”; “nominal”)?
2.1.1 Types of Models • Choice of model will dictate how modeling guidelines and acceptance criteria are expressed • FEMA 356/ASCE 41 tends towards “concentrated spring” models, although “fiber-type” models are common for RC walls
2.1.2 Component Attributes • Idealized “Backbone” Curve for Spring-Type Model • elastic, hardening, peak, and post-peak(?) response • is degradation captured in cyclic model? • - “modified backbone curve” (FEMA 356/ASCE 41) • calibrate properties to average (mean) values
2.1.3 Energy Dissipation & Damping • definition of “damping” depends how it is modeled • Hysteretic versus Viscous • Type of Analysis Model (physical vs. phenomenological) • amplitude dependent • - service versus DBE and MCE • unique characteristics of tall buildings (vs. low-rise) • less damping induced by soil-structure interaction • unique characteristics of cladding, partitions, etc.
2.1.4 Gravity Loading • Mean (Expected) Values of Gravity Loading • 1.0D + 0.2L • 1.0D + 0.5L (for non-reduceable LL) • Same values used for gravity load and seismic mass
2.1.5 Acceptance Criteria • Serviceability • - onset of significant structural damage • - check using elastic analysis • - assess based on mean of component criteria • MCE Level (or Collapse Prevention) • - onset of significant degradation • - check of component criteria if degradation is not modeled in analysis • - suggested drift requirements • IDR < 0.03 (mean of 7 records) • IDR < 0.045 (maximum of 7 records)
2.4 Damping in NLTH Analysis • Definition: reduction in dynamic building response due to energy dissipation of structural and nonstructural components of the building, its foundation, and the underlying soil/rock materials • Complicating Factors: The interpretation and representation of damping is complicated by – • relationship of mathematical representation of damping to the physical sources of damping, e.g., (1) artificial distinctions between energy dissipation of structural components that is modeled by nonlinear hysteretic response versus equivalent viscous damping, (2) modification of input motions to account for reduction in response due to SSI effects • amplitude dependency (displacement, velocity, acceleration) of damping effects and its effect on building performance for different overall intensity of building response, and (b) different effects for alternative vibration modes.
2.4.1 Physical Sources of Damping • SUPERSTRUCTURE – STRUCTURAL: • Primary Structural Components whose nonlinear behavior may be explicitly modeled in the analysis (e.g., walls, beams, columns, …) • “Secondary” Structural Components that contribute to response but whose energy absorbing characteristics may not be modeled explicitly (e.g., energy dissipation provided gravity framing, deformations to floor slab at slab-wall connections, etc). • SUPERSTRUCTURE – “NONSTRUCTURAL” • Exterior Cladding – a likely source of considerable damping, depending on the material, method of attachment, expansion joints. • Interior Wall Partitions and Finishes (issues – materials, method of attachment of finishes to structural walls/braces/columns, method of attachment of partitions to slabs, “density” of partitions – i.e., open office versus partitioned residential) • Mech/Electrical - piping, electrical conduit, HVAC risers, elevator rails and cables, stairs, etc. • SUBSTRUCTURE – FOUNDATION & SITE • Energy dissipation at soil-foundation interface (e.g, soil yielding and gapping)) and in surrounding soil deforms due to building motion
2.4.2 Survey of Practice • Wind Engineering • Occupant comfort: 0.5-1.0% steel, 1.0-1.5% RC • Strength design: 1.0-1.5% steel, 1.5-2.0% RC • Earthquake Engineering • Elastic vs. Inelastic Analysis (e.g., LATBC 5 - 10% for DBE, 7.5-12.0% at MCE) • SAC Steel Project 2% • SF AB083 <5% • CTBUH – Japan: 2% steel, 3% RC • CTBUH 2-5% steel, 5% RC • China (Li et al.) 3%
2.4.3 Measurements Goel/Chopra • Recorded during earthquakes • (peak IDR = 0.5 to 1%) • Range of Values • < 30 stories: 2% to 12% • > 30 stories: 2% to 4% • No clear trend in amplitude differences with building height or damping differences with roof drift ratios
2.4.2 Measurements Satake et al. • Mostly forced vibration , a few ambient & strong ground shaking • (peak RDR = 0.002% ?) • Range of Values (generally smaller than Goel/Chopra): • < 30 stories: <4% steel, < 8% RC • > 30 stories: <2% • Attribute major differences to less soil-structure interaction in tall buildings
2.4.2 Measurements in Wind Storms • Mostly forced vibration , a few ambient & strong ground shaking • (peak RDR = 0.002% ?) • Range of Values (generally smaller than Goel/Chopra): • < 30 stories: <4% steel, < 8% RC • > 30 stories: <2% • Attribute major differences to less soil-structure interaction in tall buildings
2.4.4 How is Damping Represented • Explicit modeling of nonlinear hysteretic respond of structural components • Equivalent viscous (velocity proportional) damping, i.e., [C] • Modification of input ground motion by filtering or scaling to damped hazard levels NOTE – scaling 5% GM spectra to 5% damped spectrum does NOT result in a reduction in ground motions
Raleigh (proportional) Damping: • a and b are usually set to provide some level of “critical damping” in certain modes, but for nonlinear analysis the meaning of this is less clear • mathematical conveniences of Raleigh damping do not apply for NL analysis Explicit Damping Elements (more transparent?) [c]i [c]i configured to represent likely sources of viscous and other incidental damping. 2.4.4 Viscous Damping with NLTH Analysis
2.4.4 Issue with Raleigh (Prop.) Damping • Fixed or Variable [C]: Should [C] be varied during the analysis, either as a function of [Kt] or other parameters? • Studies suggest that [C] should be varied (reduced) as function of the reduced [Kt] so as not to over-damp the yielded structure. • Take care if artificial “rigid-plastic” springs are introduced into the model, lest they lead to generation of very large damping forces, which may lead to large equilibrium violations for the yielded structure.
2.4.5 Damping Recommendations D (% critical) = a/N (for IDR = 0.5% to 1.0%) (30 ST – 2.7% to 70 ST – 1.1%)
Section 3.1 Characterizing NL Properties • Key Parameters (MEAN values) • Pre-Yield Stiffness • Yield and Maximum Strength • Deformations (capping point, post-capping)
Section 3.2 Statistical Uncertainties • Characterization of Variability • Statistics from Tests • Judgments • Other modes of failure • Lab tests versus real conditions • Typical COVs (std(ln)) • Well defined & understood 0.2 to 0.3 • Not well defined or measured 0.5 to 0.6
Section 3.5 Modeling & Criteria for RC Frames (Conforming Beam-Columns & B-C Joints)
RC Column Simulation Model Calibration • Key Parameters: • strength • initial stiffness • post-yield stiffness • plastic rotation (capping) capacity • post-capping slope • cyclic deterioration rate • Calibration Process: • 250+ columns (PEER database) • flexure & flexure-shear dominant • calibrated to median (characteristic) values
RC Beam-Column Initial Stiffness Haselton, Lange, Liel, Deierlein (2008) ASCE 41 (Elwood et al., 2007) YIELD: EI/EIg = 0.3 to 0.7
Qcap RC Beam-Column Parameters • Semi-Empirical -- calibrated from tests, fiber analyses, and basic mechanics: • Secant Stiffness (EIeff) • Yield Strength (My) • Hardening Stiffness • Empirical - calibrated from tests: • Capping (peak) point • Post-peak unloading (strain softening) stiffness • Hysteretic stiffness/strength degradation
Structural Modeling: Model Calibrations Equation for plastic rotation capacity:
ASCE 41 (Conforming, Flexural Failure) Haselton et al., Qpl = 0.02 to 0.08 for p”=0.0075
RC Beam-Column Joint Model ASCE 41 – Modeling Recommendations
Column Spring Beam Spring Joint Panel Spring Panel zone Beam-end zone Column-end zone Idealized Joint Model • Spring Response Models • Flexural Hinging – beam & column springs • Joint Shear Distortion – joint panel spring • Bond Slip – beam, column & joint panel springs 1.5 1 0.5 Component Force (M or V) 0 -0.5 -1 -1.5 -8 -6 -4 -2 0 2 4 6 8 Deformation (Q or g)