Data Triangulation
Learn to link different data sources for robust analysis. Understand the role of data triangulation in evaluating program impacts. Discover how multiple data sources can elevate findings reliability and substantiate program outcomes. Delve into questions data triangulation can address and when to apply this approach. Explore considerations for successful data triangulation, with an illustrative example of a Female Sex Worker Program in Nepal.

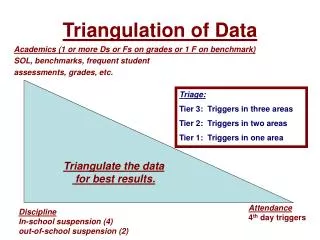
Data Triangulation
E N D
Presentation Transcript
Objectives: • At the end of the session, participants will be able to: • Describe the role of data triangulation in program evaluation • List data sources and approaches that can be used for triangulated analysis
Data Triangulation for M&E • Linking different information sources involving persons, place and time • Analysis of data from multiple sources can increase the validity and reliability of findings; it can corroborate findings and weakness of any one data source can be compensated for by the strengths of another • Analysis of program level data with outcome/impact level data can help substantiate the linkage between program interventions and population-level outcomes/impacts
Questions that data triangulation can help address: • Are interventions working and are they making a difference? • What changes in population-level outcome and impact indicators have been observed and what do they mean? • Can the observed changes in outcomes and impact indicators be attributed to program outputs? • Are the collective efforts being implemented on a large enough scale to impact the course of the epidemic? Source: A framework for monitoring and evaluating HIV prevention programmes for most-at-risk populations. UNAIDS 2007
Source of data • Repeated HIV and/or STI prevalence surveys/surveillance • Repeated population surveys with behavioral data • Routine program or service delivery data • Quality of service assurance and quality improvement assessments • Qualitative studies (in-depth interviews, focus group discussions, key informant interviews, etc) Source: A framework for monitoring and evaluating HIV prevention programmes for most-at-risk populations. UNAIDS 2007
When to do Data Triangulation • When interventions have been in place for a sufficient duration of time to reasonably expect that changes at the population level may be attributable to program interventions • When interventions have been implemented with sufficient intensity and with high enough coverage to reasonably expect effects to be observed in the target population. • When good program-level data (i.e outputs, coverage, quality of implementation are available) are available • When process evaluation indicates that program activities are being realized as planned. Source: A framework for monitoring and evaluating HIV prevention programmes for most-at-risk populations. UNAIDS 2007
Considerations • Is there a culture of data sharing? • Are data from different sources representative of te population ofinterest? • Do the time frames of te data points match?
Example 1: Female Sex Worker Program in Nepal Family Health International
Logic of the program in Nepal • Reach people with information to increase their knowledge and awareness • Provide services to allow them to act on that knowledge • Expand coverage of information and services so that so that changes are observable at the population-level • Improve the quality of services while expanding coverage (e.g. STI treatment) • Information and good quality services for enough target group members will lead to service use, which will lead to safer behaviour and lower risk of exposure to HIV Source: FHI Regional Office, Bangkok.
Program records indicate the program is being delivered and reaching more of the target population through more channels over time FHI Nepal, 2005 Source: FHI Regional Office, Bangkok.
This increasing coverage is confirmed by FSWs in target areas(exposure to NGO-related activities among FSWs, 1998 – 2002) Source: FHI Regional Office, Bangkok.
There were signs of improved quality of services e.g. STI diagnosis and treatment Source: FHI Regional Office, Bangkok.
Trends in desirable outcomes are evident – Knowledge of condoms is high among FSWs and condom carrying behavior is increasing over time, 1998 - 2002 Source: FHI Regional Office, Bangkok.
Trends in Desirable Outcomes are evident – Condom use with clients among FSWs is increasing steadily over time, 1998 - 2002 Source: FHI Regional Office, Bangkok.
Those Reached by the Program Have Safer Behaviors: Exposure to various NGO-related activities in the past year impacts on consistent condom use with clients among FSWs - 2002 Source: FHI Regional Office, Bangkok.
There is evidence of a favourable Dose-Response relationship:Greater exposure to various NGO-related activities results in better condom use behavior - 2002 *1) Received condoms, 2) received brochures/materials, 3) received IPC information about HIV/AIDS Source: FHI Regional Office, Bangkok.
Summary of Key Findings among FSWs • Program activities have expanded in scale and improved in quality • HIV and STI prevalence are decreasing over time • Knowledge of condoms is high and consistent condom use is increasing and high among clients and regular clients • Exposure to NGO-related information sources about HIV/AIDS and condoms is increasing and high • Exposure to various NGO-related activities is increasing and high • Exposure to NGO-related activities is strongly linked with condom carrying & consistent condom use in a dose-response manner Source: FHI Regional Office, Bangkok.
Example 2: Botswana Antiretroviral scale-up in Botswana National AIDS Committee Botswana, WHO, UCSF and UNAIDS (2006)
Overview of Botswana Triangulation • Objective: • To develop a model to measure the impacts of ART and PMTCT programs on adult and child mortality • Application: • Provide timely information on the impact of national scale-up of ART for policy and programmatic decision making Source: Case Study. Country-enhanced monitoring and evaluation for antiretroviral therapy scale-up: analysis and use of strategic information in Botswana. WHO 2006.
Approach • Meetings with stakeholders to identify objectives of analysis • Identification and compilation of data from many sources • Vital statistics (morbidity and mortality) • Population survey data • Patient Management systems (HMIS) • Program data (i.e. HIV testing, ART) • Examination of trends in HIV prevalence and mortality in relation to ART and PMTCT availability and service uptake Source: Case Study. Country-enhanced monitoring and evaluation for antiretroviral therapy scale-up: analysis and use of strategic information in Botswana. WHO 2006.
Source: Case Study. Country-enhanced monitoring and evaluation for antiretroviral therapy scale-up: analysis and use of strategic information in Botswana. WHO 2006.
Source: Case Study. Country-enhanced monitoring and evaluation for antiretroviral therapy scale-up: analysis and use of strategic information in Botswana. WHO 2006.
Source: Case Study. Country-enhanced monitoring and evaluation for antiretroviral therapy scale-up: analysis and use of strategic information in Botswana. WHO 2006.
Conclusions of Botswana Analysis • Since the inception the ART programme, Botswana has achieved reductions in mortality of adults aged 25–54 years • Reduced mortality is associated with early initiation of district ART programmes and with the overall rate of ART uptake in the district. Source: Case Study. Country-enhanced monitoring and evaluation for antiretroviral therapy scale-up: analysis and use of strategic information in Botswana. WHO 2006. Source: Case Study. Country-enhanced monitoring and evaluation for antiretroviral therapy scale-up: analysis and use of strategic information in Botswana. WHO 2006.
Strengths and Limitations of Triangulation • Strengths • Pre-existing data sources are used • Can provide relatively rapid results • Limitations • Existing data may be insufficient • Institutional barriers to data sharing
Triangulation Resources • HIV Triangulation Resource Guide: Synthesis of Results from Multiple Data Sources for Evaluation and Decision-making (WHO 2009) • Data Triangulation for HIV Prevention Program Evaluation in Low and Conncetrated Epidemics (FHI 2010)
MEASURE Evaluation is a MEASURE project funded by the U.S. Agency for International Development and implemented by the Carolina Population Center at the University of North Carolina at Chapel Hill in partnership with Futures Group International, ICF Macro, John Snow, Inc., Management Sciences for Health, and Tulane University. Views expressed in this presentation do not necessarily reflect the views of USAID or the U.S. Government. MEASURE Evaluation is the USAID Global Health Bureau's primary vehicle for supporting improvements in monitoring and evaluation in population, health and nutrition worldwide.