Download
1 / 71
710 likes | 858 Views
Software Engineering II Project Organization & Management. Scheduling. Where are we?. Work Breakdown Structures Estimation Scheduling. ✔. ✔. today. Managing Complexity. Using proven strategies: Divide & Conquer Minimize coupling Maximize coherence. Object Identification.

E N D
Software Engineering II Project Organization & Management Scheduling
Where are we? • Work Breakdown Structures • Estimation • Scheduling ✔ ✔ today
Managing Complexity • Using proven strategies: • Divide & Conquer • Minimize coupling • Maximize coherence Object Identification Identification of Tasks Problem decomposition (Service identification (func.), Modularization (struct.) and Architecture (subsys. decomp.) Work Breakdown Structure (functional, object-oriented, geographical) Identification of Attributes Identification of Time as an important Attribute Identification of Associations(aggregation, inheritance) Dependencies (aggregation, successive/parallel tasks)
Managing Change • Change influences management aspects as much as technical aspects. Software Configuration Management Release Management and Roadmapping Incremental Development Incremental Planning/Estimation Iterative Software-Lifecycles Iterative Planning/Estimation (Cone of uncertainty [Boehm 1981])
Cone of uncertainty [Boehm 1981] • Therefore multiple estimations are needed: • At the beginning • After system design • After detailed design
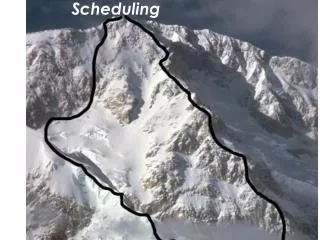
Camp III Camp II Camp I Summit of Denali (Mt. McKinley) Cassin Ridge West Rib Camp I
Outline • Preconditions: WBS and Estimates • Dependency diagrams • Determining times of activities • Determining critical path and slack times • Determining project duration • Scheduling Heuristics • How to live with a given deadline • Optimizing schedules • Rearranging schedules
Why Dependency Diagrams? • Example: • A project consists of 5 tasks; each of these takes one week to complete. • How long does the project take? • Example: • A project consists of 5 tasks. Task 1 has to be finished before any other tasks can start. Task 2 and task 3 can be done in parallel, task 4 and 5 cannot. Task 4 and 5 both depend on task 2. • Can the project be finished in 3 weeks, if each of the tasks takes a week to complete? • What if 4 and 5 could be done in parallel and 2 and 3 could not? • Dependency Diagrams are a formal notation to help in the construction and analysis of complex schedules
Dependency Diagrams (Overview) • Dependency diagrams consist of three elements • Event: A significant occurrence in the life of a project. • Activity: Amount of work required to move from one event to the next. • Span time: The actual calendar time required to complete an activity. • Span time parameters: availability of resources, parallelizability of the activity • Dependency diagrams are drawn as a connected graph of nodes and arrows. Two commonly used notations to display dependency diagrams are: Activity-on-the-arrow Activity-in-the-node
The Polaris Missile Project • The project started in 1956 • Its goal was to develop a submarine-launched, two-stage solid-fuel nuclear-armed ballistic missile (SLBM) as replacement for the Regulus cruise missile • Because of the high uncertainty of the project (research and development of completely new parts – lots of contractors) a new project management technique was needed.
PERT • PERT stands for “Program Evaluation and Review Technique” • PERT uses an activity-on-the-arrow notation • Algorithm: • Assign optimistic, pessimistic and most likely estimates for the span times of each activity. • Compute the probability that the project duration will fall within specified limits. • At first the method did not take cost into consideration but was later extended to cover cost as well. • Still more fitting for projects where duration matters more than cost.
Event (Milestone or Deliverable) Event (Milestone or Deliverable) System Design DesignReview AnalysisReview t = 4 weeks 1) Activity-on-the-arrow Diagram Notation Activity A B t Span Time
A A tA = 0 B B tB = 2 C C tC = 0 Event (Milestone or Deliverable) Event (Milestone or Deliverable) System Design t = 2 weeks SDD available t = 0 2) Activity-in-the-node Diagram Notation Activity A Node is either an activity or an event. Distinction: Events have span time 0 Milestone boxes are often highlighted by double-lines RAD available t = 0
Example of an Activity-in -the -Node Diagram Activity 2 t2 = 1 Activity 1 t1 = 5 Start t = 0 End t = 0 Activity 3 t3 = 1 Activity 4 t4 = 3 Activity5 5= 2
What do we do with these diagrams? • Compute the project duration • Determine activities that are critical to ensure a timely delivery • Analyze the diagrams • To find ways to shorten the project duration • To find ways to do activities in parallel • 2 techniques are used • Forward pass (determine critical path) • Backward pass (determine slack time)
Definitions: Critical Path and Slack Time • Critical path: • A sequence of activities that take the longest time to complete • The length of the critical path(s) defines how long your project will take to complete. • Noncritical path: • A sequence of activities that you can delay and still finish the project in the shortest time possible. • Slack time: • The maximum amount of time that you can delay an activity and still finish your project in the shortest time possible.
Activity 1 t1 = 5 Start t = 0 End t = 0 Activity5 t5 = 2 Critical path with bold and red arrows Example of a critical path Activity 2 t2 = 1 Activity 1 t1 = 5 Start t = 0 End t = 0 Activity 3 t3 = 1 Activity 4 t4 = 3 Activity5 5= 2
Analyzing Dependency Graphs • Determination of critical paths • Determination of slack times
Analyzing Dependency Graphs • Determination of critical paths • Compute earliest start and finish dates for each activity • Start at the beginning of the project and determine how fast you can complete the activities along each path until you reach the final project milestone. • Also called forward path analysis • Determination of slack times • Start at the end of your project, figure out for each activity how late it can be started so that you still finish the project at the earliest possible date. • Also called back path analysis
Definitions: Start and Finish Dates • Earliest start date (ES): • The earliest date you can start an activity • Earliest finish date (EF): • The earliest date you can finish an activity • Latest start date (LS): • The latest date you can start an activity and still finish the project in the shortest time • Latest finish date (LF): • The latest date you can finish an activity and still finish the project in the shortest time.
Computing Start and Finish Times • To compute start and finish times, we apply two rules Rule 1: After a node is finished, we can proceed to the next node(s) that is (are) reachable via a transition from the current node. Rule 2: To start a node, all nodes from which transitions to that node are possible must be complete.
Summary: Analyzing Dependency Diagrams • Forward pass: Goal is the determination of critical paths • Compute earliest start and finish dates for each activity • Backward pass: Goal is the determination of slack times • Compute latest start and finish dates for each activity • Rules for computing start and finish times • Rule 1: After a node is finished, proceed to the next node that is reachable via a transition from the current node. • Rule 2: To start a node all nodes from which transitions to that node are possible must be complete.
Activity 1 t1 = 5 Activity 2 t2 = 1 Start t = 0 End t = 0 Activity 3 tA = 1 Activity 4 tA = 3 Activity5 t5 = 2 Forward Path Analysis Activity 2 t2 = 1 Activity Earliest Start (ES) Earliest Finish (EF) Project Duration = 7 Activity 3 t3 = 1 Activity 4 t4 = 3 A1 Start of week 1 End of week 5 A2 Start of week 6 End of week 6 A3 Start of week 1 End of week 1 A4 Start of week 2 End of week 4 A5 Start of week 6 End of week 7
Activity 1 t1 = 5 Activity 2 t2 = 1 Start t = 0 End t = 0 A1 End of week 5 Activity 3 tA = 1 Activity 4 tA = 3 Activity5 t5 = 2 A4 End of week 5 Backward Path Analysis Activity 2 t2 = 1 Activity Latest Start (LS) Latest Finish (LF) Project Duration = 7 Activity 3 t3 = 1 Activity 4 t4 = 3 Start of week 1 A2 End of week 7 Start of week 7 A3 End of week 2 Start of week 2 Start of week 3 A5 End of week 7 Start of week 6
Activity 2 t2 = 1 Activity 1 t1 = 5 Start t = 0 End t = 0 Activity 2 t2 = 1 Activity 3 tA = 1 Activity 4 tA = 3 Activity5 t5 = 2 Activity A1 A2 A3 A4 A5 Slack time 0 1 1 1 0 Activity 4 t4 = 3 Computation of slack times • Slack time ST of an activity A: • STA = LSA - ESA Example: STA4 = ? STA4 = 3 - 2 = 1 Slack times on the same path influence each other. Example: When activity 3 is delayed by one week, activity 4 slack time becomes zero weeks.
Path types in dependency graphs • Critical path: Any path in a dependency diagram, in which all activities have zero slack time. • Noncritical path: Any path with at least one activity that has a nonzero slack time. • Overcritical path: A path with at least one activity that has a negative slack time. • Overcritical paths should be considered as serious warnings: Your plan contains unrealistic time estimates
Path types in dependency graphs cont. • Any dependency diagram with no fixed intermediate milestones has at least one critical path. • A project schedule with fixed intermediate milestones might not have a critical path • Example: • The analysis review must be done 1 month after project start • The estimated time for all activities before the review is less than 4 weeks.
Types of Dependencies(Examples taken from Microsoft Project) • Finish-to-start (FS)Task (B) cannot start until task (A) finishes. For example, if you have two tasks, "Construct fence" and "Paint fence," "Paint fence" can't start until "Construct fence" finishes. This is the most common type of dependency. • Start-to-start (SS)Task (B) cannot start until task (A) starts. For example, if you have two tasks, "Pour foundation" and "Level concrete," "Level concrete" can't begin until "Pour foundation" begins. • Finish-to-finish (FF)Task (B) cannot finish until task (A) finishes. For example, if you have two tasks, "Add wiring" and "Inspect electrical," "Inspect electrical" can't finish until "Add wiring" finishes. • Start-to-finish (SF)Task (B) cannot finish until task (A) starts. This dependency type can be used for just-in-time scheduling up to a milestone.
Dependency constraints • As Soon As Possible (ASAP) – FlexibleSchedule the task as soon as possible without any other restrictions. • Start No Earlier Than (SNET) – ModerateSpecify the earliest date for a task to start. The task cannot start before that date. • Start No Later Than (SNLT) – ModerateSpecify the latest possible date for a task to begin. The task cannot be pushed to start after that date. • Must Start On(MSO) – InflexibleThe task must start on that exact date. • As Late As Possible(ALAP) – FlexibleSchedule the task as late as possible without any other restrictions. • Finish No Earlier Than (FNET) – ModerateSpecify the earliest date for a task to end. The task cannot end before that date. • Finish No Later Than (FNLT) – ModerateSpecify the latest possible date for a task to end. The task cannot be pushed to end after that date. • Must Finish On(MFO) – InflexibleThe task must finish on that exact date.
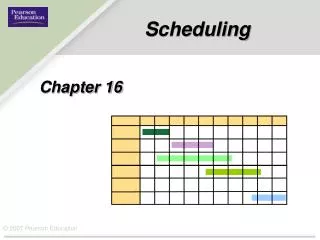
Frequently used formats for schedules • Milestone View: • A table that lists milestones and the dates on which you plan to reach them. • Activities View: • A table that lists the activities and the dates on which you plan to start and end them • Gantt chart View: • A graphical view illustrating on a timeline when each activity will start, be performed and end. • Combined Gantt Chart and Milestone View: • The Gantt Chart contains activities as well as milestones. • PERT Chart View: • A graphical representation of task dependencies and times. • Burndown Chart View: • A graph showing the number of open tasks over time.
Milestone View (Key-Events Report) Date Milestone August 26 Project Kickoff (with Client) October 16 Analysis Review October 26 System Design Review November 7 Internal Object Design Review November 20 Project Review (with Client) November 26 Internal Project Review December 11 Acceptance Test (with Client) Good for introduction of project and high executive briefings
Activities View DateProject Phases Jul 17 - Aug 23 Preplanning Phase Aug 26 - Sep 24 Project Planning Sep 11 - Oct 8 Requirements Analysis Oct 9 - Oct 26 System Design Oct 28 - Nov 7 Object Design Nov 8 - Nov 20 Implementation & Unit Testing Nov 22 - Dec 4 System Integration Testing Dec 4 - Dec 10 System Testing Dec 11- Dec 18 Post-Mortem Phase Good for documentation and during developer meetings
Gantt Chart Activity 1 Activity 2 Activity 3 Activity 4 Activity 5 0 1 2 3 4 5 6 7 Easy to read Time (in weeks after start)
Project Start Design Review Project Finish with milestones Gantt Chart Activity 1 Activity 2 Activity 3 Activity 4 Activity 5 0 1 2 3 4 5 6 7 • Good for reviews Time (in weeks after start)
Joe A1 A2 A3 A1 Joe, Toby Mary A2 Joe Toby A3 A1 A3 Clara, Toby, Joe Clara A3 Time Time Two Types of Gantt Charts • Activity-Centered View • To identify teams working together on the same tasks • Person-Centered View • To determine people‘s work load
PERT Chart • Good overview of task dependencies
Burndown Chart • Good for project controlling
Which view should you use? • Milestone View: • Good for introduction of project and high executive briefings • Activity View: • Good for developer meetings • Gantt Chart Views:Base the view on the WBS structure and on the experience of the participants: • Managing experienced teams - use a person-centered view • Managing beginners - use an activity oriented view • PERT Chart View: • Good for clear illustration of task dependencies. • Burndown Chart View: • Good for progress reports, project controlling.
Developing a Schedule for Integration Testing Five Steps: 1. Start with System Decomposition 2. Determine your Integration Testing Strategy 3. Determine the Dependency Diagram 4. Add Time Estimates 5. Visualize the activities on a time scale: Gantt Chart
2. Determine the Integration Testing Strategy • There are many integration testing strategies • We choose sandwich testing • Sandwich testing requires 3 layers • Reformulate the system decomposition into 3 layers if necessary • Identification of the 3 layers and their components in our example • Top layer: A • Target layer: B, C, D • Bottom layer: E, F, G
3. Determine the Dependency Diagram (UML Activity Diagram) Target layer components: B, C, D
Tools support • Microsoft Project: PERT, Gantt, Milestone/Gantt Charts • Windows • Demo: http://www.microsoft.com/office/project • Fast Track: Gantt Charts • Multiplatform: Windows, MacOS X, Palm • Demo: http://www.aecsoftware.com/ • Shared Plan: PERT, Gantt, Milestone/Gantt Charts • Multiplatform: Windows, MacOS X, Linux • Compatible with Microsoft Project • Demo: http://www.sharedplan.com/ • Merlin: Gantt Charts, Mindmaps • MacOS X • Demo: http://www.novamind.com/merlin/
Scheduling Heuristics • How to develop an initial project schedule • How to shorten the project duration • Mistakes made during preparation of schedules • The danger of fudge factors • How to identify when a project goes off-track (actual project does not match the project plan). • How to become a good software project manager
How to develop an Initial Project Schedule • Identify all your activities • Identify intermediate and final dates that must be met • Assign milestones to these dates • Identify all activities and milestones outside your project that may affect your project’s schedule • Identify “depends on” relationships between the activities • Draw a dependency diagram for the activities and relationships • Determine critical paths and slack times of noncritical paths.
Reducing the planned project time • Recheck the original span time estimates • Ask other experts to check the estimates • Has the development environment changed? (batch vs. interactive systems, desktop vs. laptop development) • Consider different strategies to perform the activities • Consider to Buy a work product instead of building it (Trade-off: Buy-vs.-build) • Consider extern subcontractor instead of performing the work work internally
Reducing the planned project time (2) • Hire more experienced personnel to perform the activities • Trade-off: Experts work fast, but cost more • Try to find parallelizable activities on the critical path • Continue coding while waiting for the results of a review • Risky activity, portions of the work may have to be redone. • Develop an entirely new strategy to solve the problem