Download
1 / 1
20 likes | 187 Views
(2) (3) (4) (4) updated (5) Low interaction (5) High interaction (6) (6) updated. + 30 %. - 30 %. (9). + 20%. (7). (8). (2). (4). - 20%. (6). CHEMICAL REACTION ENGINEERING LABORATORY. Flow Distribution, Pressure Drop and Liquid Holdup in a High-Pressure Trickle Bed Reactor

E N D
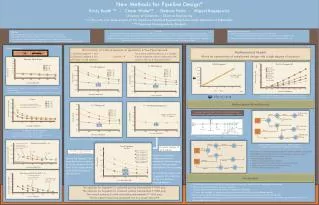
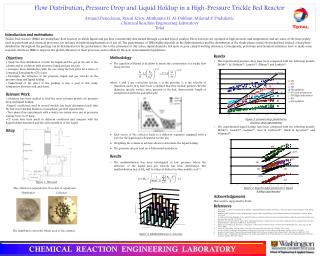
(2) (3) (4) (4) updated (5) Low interaction (5) High interaction (6) (6) updated + 30 % - 30 % (9) + 20% (7) (8) (2) (4) - 20% (6) CHEMICAL REACTION ENGINEERING LABORATORY Flow Distribution, Pressure Drop and Liquid Holdup in a High-Pressure Trickle Bed Reactor Arnaud Denecheau, Pascal Leroy, Muthanna H. Al-Dahhan, Milorad P. Dudukovic Chemical Reaction Engineering Laboratory Total • Introduction and motivations • Trickle-bed reactors (TBRs) are multiphase flow reactors in which liquid and gas flow concurrently downward through a packed bed of catalyst. These reactors are operated at high pressure and temperature and are some of the most widely used in petroleum and chemical processes, for instance in hydrodesulphurization of gas oil. The performance of TBRs highly depends on the hydrodynamics and the distribution of the fluids phases inside the packed bed. Indeed, a bad phase distribution throughout the packing can be detrimental for the performance due to the formation of dry zones, liquid channels, hot spots or poor catalyst wetting efficiency. Consequently, petroleum and chemical industries have to make some research efforts on TBRs to improve the global efficiency of their processes and to abide by the new environmental legislations. Results • The experimental pressure drop have been compared with the following models: Holub(2), Al-Dahhan(3), Larachi(4), Ellman(5) and Larkins(6). • The experimental liquid holdup have been compared with the following models: Holub(2), Larachi(4), Larkins(6), Saez & Carbonell(7), Baldi & Specchia(8) and Wammes(9). • Acknowledgements • This work is supported by Total. • References • Marcandelli C., Lamine A.S., Bernard J.R. and Wild G. “Liquid Distribution in Trickle-Bed Reactor,” Oil & Gas Science and Technology. Rev. IFP, 55 (4), 407 (2000) • Holub, R.A., M.P. Dudukovic, and P.A. Ramachandran, “Pressure Drop, Liquid Holdup, and Flow Regime Transition in Trickle Flow,” AIChE J., 39 (2), 302 (1993). • Al-Dahhan, M.H., M.R. Khadilkar, Y. Wu, and M.P. Dudukovic, “Prediction of Pressure Drop and Liquid Holdup in High-Pressure Trickle-Bed Reactors,” Ind. Eng. Chem. Res., 37, 793 (1998). • Larachi, F., A. Laurent, N. Midoux, and G. Wild, “Experimental study of a trickle-bed reactor operating at high pressure: two-phase pressure drop and liquid saturation,” Chem. Eng. Sci., 46 (5/6), 1233 (1991a) • Ellman, M. J., N. Midoux, A. Laurent, J.C. Charpentier, “ A New, Improved Pressure Drop Correlation for Trickle Bed Reactors,” Chem. Eng. Sci., 43, 2201 (1988). • Larkins, R.P., R.R. White, and D.W. Jeffrey, “Two-Phase Concurrent Flow in Packed Beds,” AIChE J., 7, 231 (1961) • Sáez, A.E., and R.G. Carbonell, “Hydrodynamic Parameters for Gas-Liquid Cocurrent Flow in Packed Beds,” AIChE J., 31 (1), 52 (1985) • Specchia, V., and G. Baldi, “Pressure Drop and Liquid Holdup for Two Phase Concurrent Flow in Packed Beds,” Chem. Eng. Sci., 32, 515 (1977) • Wammes, W.J.A., J. Middelkamp, W.J. Huisman, C.M. deBaas, and K.R.Westerterp, “Hydrodynamics in a Cocurrent Gas-Liquid Trickle Bed at Elevated Pressures,” AIChE J., 37, 1849 (1991b) Objectives • Study the flow distribution of both the liquid and the gas at the exit of the column and its evolution with pressure, liquid and gas velocity. • Compare these distribution with the one along the bed given by a series of Computed Tomography (CT) scans. • Investigate the influence of the pressure, liquid and gas velocity on the pressure drop and liquid holdup. • Understand of the effect of the packing is also a goal of this study. Comparison between sock and dense. • Relevant Work • Literature has been studied to find the most relevant models for pressure drop and liquid holdup. • Ergun’s coefficient, used in several models, has been determined each time the bed was repacked thanks to monophasic gas flow experiments. • Two-phase flow experiments with a water/air system were ran at pressures scaling from 1 to 9 barg. • CT scans have been made in different conditions and compare with the liquid holdup measured and the exit repartition of the liquid. Setup The collector is separated in 15 sectors of equal area. Distributor Collector The distributor covers the whole area of the column. • Methodology • The equation of Bansal et al allows to insure the conservation of a trickle flow along the bed. where landxare correction factors, e is the porosity, Lt is the velocity of transition and S1 & S2 have been so defined that they include particle effective diameter, specific surface area, porosity of the bed, characteristic length of nonspherical particles and sphericity. • Each sector of the collector leads to a different separator equipped with a level for the liquid and a flowmeter for the gas. • Weighting the column at all time allows to determine the liquid holdup. • The pressure drop is read on a differential transducer Results • The maldistribution has been investigated at low pressure where the influence of the liquid and gas velocity has been determined. The maldistribution factor, Mf, will be taken as defined in Marcandelli et al.(1): Figure 3. pressure drop predicted vs. pressure drop experimental Figure 1. Pilot unit Figure 4. liquid holdup predicted vs. liquid holdup experimental Figure 2. Maldistribution vs. velocities