Download
1 / 33
330 likes | 478 Views
State Regents Meeting January 31, 2013. Adults with Bachelor’s Degree or Higher (2011). Source: U.S. Census Bureau, 2011 American Community Survey. 84% of national average. . Bachelor Degree Attainment by Age 24, by Family Income, 2011. >$105k. $ 63-105k. $ 33-63k. <$33k.

E N D
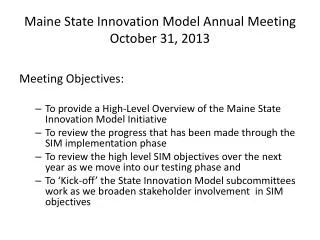
State Regents Meeting January 31, 2013
Adults with Bachelor’s Degree or Higher (2011) Source: U.S. Census Bureau, 2011 American Community Survey. 84% of national average.
Bachelor Degree Attainment by Age 24, by Family Income, 2011 >$105k $63-105k $33-63k <$33k Source: Postsecondary Education OPPORTUNITY, Number 245, November 2012, www.postsecondary.org.
OKPromise High School Enrollment(By High School Graduation Year) $50,000 $32,000 $24,000 As of 12-20-12
Estimated Percent of Oklahoma Families with Total Income Under $50,000 Source: US Census Bureau, 2000 Census, American Community Survey-2001-2011
Oklahoma Public School Students Eligible for Free/Reduced Lunch Source: Office of Accountability, Profiles State Reports, 2007-2011
Inflation Impact on $50,000 Income Limit • $50,000 in 2012 equivalent to about $37,600 in year 2000 dollars* • $50,000 in year 2000 dollars equivalent to about $66,500 in year 2012 dollars* *based on national consumer price index; 33% rate of inflation from 2000 to 2012
High School Requirement Completion Rates $50,000 $32,000 As of 12-20-12
High School Students Completing OKPromise Requirements(by Grad Year) $50,000 $32,000 $24,000 As of 1-2-13
2012 OKPromise State Champions 6A-Union-Tulsa (128) 2A-Northeast Academy-OKC (28) 3A-Dove Science Academy-OKC (35) 4A-Santa Fe South-OKC (70) 5A-Del City (59) B-Moss (10) B-Wapanucka (10) A-Wright City (15)
Union Public Schools Students Eligible for Free/Reduced Lunch Source: Office of Accountability, Profiles District Reports, 2000-2011
Oklahoma City Public Schools Hispanic Student Population Source: Office of Accountability, Profiles District Reports, 2000-2011
2012 Gates Millennium Scholars • It appears that about 37 of 53 (70%) Gates Foundation Millennium Scholars named in Oklahoma in 2012 are OKPromise students.* *Tulsa World article, 7/2/12
Gender TrendsOKPromise High School Grads, 2002-2012 OK H.S. Seniors: 49% Female, 51% Male Female Male
Geographic Distribution Trends OKPromise High School Grads, 2004-2012 “Urban” is defined as the 5 most populous counties – Oklahoma, Tulsa, Cleveland Canadian, and Comanche.
2012 ACT Testers By Income* *Self-reported on ACT test application
2012 Average ACT Scores By Income* *Self-reported on ACT test application
Full-Time College Enrollment First-time entering students enrolled in 12 hours or more per fall or spring semester
College Freshman – GPA of at least 2.0 Percentages calculated based on students with GPA reported to UDS.
Employment of College Graduates in Oklahoma(after 1 year, April 2010 – June 2011)
Scholarship Recipients As of 1-2-13
Factors Impacting Future Enrollment and Cost of Oklahoma’s Promise • Shrinking pool of potential applicants ($50,000 limit unchanged since 2000) • New statutory 2nd family income check for 2012 high school graduates • New statutory college GPA and “Satisfactory Academic Progress” requirements beginning in fall 2012
Scholarship Expenditures(In $ millions, by fiscal year) Projected Actual As of 11-14-12