Unlocking Business Intelligence with Microsoft PerformancePoint Server 2007
Discover how Microsoft PerformancePoint Server 2007 enhances performance management through advanced analytics, reporting, and planning capabilities. Learn to execute strategies effectively by monitoring organizational goals with dynamic dashboards and scorecards. This solution enables rich data visualization, collaborative budgeting, and consolidates financial reporting—all in an intuitive Excel environment. With PerformancePoint, organizations can drive accountability, integration, and transparency in their business processes while gaining actionable insights for strategic planning.


Unlocking Business Intelligence with Microsoft PerformancePoint Server 2007
E N D
Presentation Transcript
Performance Point Overview Shivani Inderjee Business Intelligence Specialist Microsoft
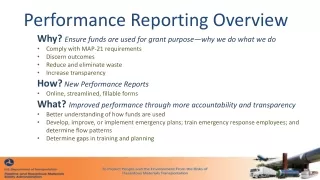
Performance ManagementBetter execute on strategy What happened? What is happening? Why? What will happen?What do I want to happen?
Performance ManagementCapabilities required What is happening? Scorecards and Dashboards What happened? Reporting Why did it happen? Analytics What will happen?Forecasting What do I want to happen? Planning, Budgeting, Consolidation
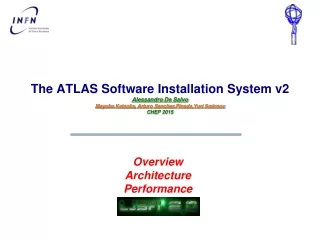
Our Integrated Business Intelligence Offering DELIVERY COLLABORATION CONTENT MANAGEMENT SharePoint Server SEARCH Reports Dashboards Excel Workbooks Analytic Views Scorecards Plans END USER TOOLS AND PERFORMANCE MANAGEMENT APPS Excel PerformancePoint Server BI PLATFORM SQL Server Reporting Services SQL Server Analysis Services SQL Server DBMS SQL Server Integration Services
The OLAP Report There is now no doubt that Microsoft is deadly serious about taking a very big bite out of the performance management market. PerformancePoint has a scalable architecture, designed with considerable attention to performance, and early customer reports are positive. Indeed, PerformancePoint is reported already to outperform some of the established market-leading products. (OLAP Report, June 27, 2007) Nigel Pendse Download preview here
PerformancePoint Server 2007 Authoring Design, Publish, Maintain Consume View, Contribute, Analyse Dimensions Dashboards/Scorecards/KPI Business Data Models Strategy Maps Business Logic Process Control Views, Forms, Reports Business Rules Model to Model Associations Data Visualisations Security
PerformancePoint Server 2007 Planning Business users can interact with and continuously contribute to the business processes of planning, budgeting and forecasting in the familiar and easy to use Office Excel environment.
Planning And Modeling • Business users design models the way they think about their business • Top-down and bottom-up planning functionality connecting people and driving accountability • Process management to manage forms, workflows, submissions, approvals, reports, notifications and annotations • Secure and auditable environment • Spans from single model deployments to enterprise scenarios
Reporting And Consolidation • Construct models that drive profitability analysis incorporating standard financial functionality • Support management andGAAP consolidation process with multiple currency conversions, inter-company eliminations and reconciliations, multi-tier allocations • Dynamic and standard reports including financial and business performance reports • Publish live reports from Excel to Reporting Services and Microsoft Office Server providing consistency of experience for report consumers
CapEx Forecast Forecast Forecast CapEx Sales Pricing Pricing Sales Pricing OpEx Consol. OpEx Handling Real-World Complexity Corporate Account Entity Scenario Time Product Family Business Unit 1 Business Unit 2 Account Account Entity Entity Scenario Scenario Time Time Product Service Customer Market Segment Flexibility within a Framework
PerformancePoint Server 2007Monitor performance • Display the organisation’s strategy and its targets, goals, and alerts in a visual format to allow users to monitor and take action.
Rich Monitoring Capabilities • Spans from personal performancedashboards to formal methodology-based and cascading scorecards • Access wide range of structuredand unstructured data-sources for more comprehensive dashboards and scorecards • Rich dashboard filters to dynamically filter all views on the dashboard. • Contextual KPIs and reportsreflect changes in planning, budgeting, and forecasting data • Dynamic Strategy Maps linked to KPI data • Assign owners to KPIs for accountability
PerformancePoint Server 2007Analyse performance • Analytics and data visualisationmake it easy for users to understand complex information faster, spot highlights, trends and opportunities.
Analysis And Data Visualization • Web-based thin analysis provides users with rich analytical functionality out of the box, minimizing help required from IT Staff • Analytics include multidimensional slice and dice, drill-across, drill-to-detail, root-cause analysis, and centralized business logic definitions • Predictive analytics allow for forecasting and trend analysis • Guided and contextual analysis through tight integration of KPIs and analytics in the dashboard • Advanced Data Visualizations such as decomposition trees and performance maps
Analysis Drives Better Planning • Collaborate on analytic insights • Update the business plan and continue to monitor performance
Dashboard Designer • Familiar Microsoft Office 2007 look and feel • Fast Time to Delivery and Ease of Administration • Designed for collaboration and reuse • Offline capabilities • Built-in templates and wizards allow user to quickly build and share dashboards and scorecards
Enterprise Ready • Familiar Microsoft Office 2007 look and feel • Fast Time to Delivery and Ease of Administration • Designed for collaboration and reuse • Offline capabilities • Built-in templates and wizards allow user to quickly build and share dashboards and scorecards
Summary • Used to drive business performance • Integrated Performance Management application • Flexibility of the framework • Easy to use and learn • Simple and cost-effective licensing to enable broad deployment
Thank you http://www.microsoft.com/southafrica/ucs/2007