Download
1 / 18
180 likes | 311 Views
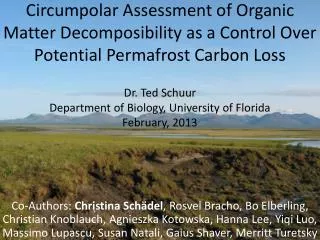
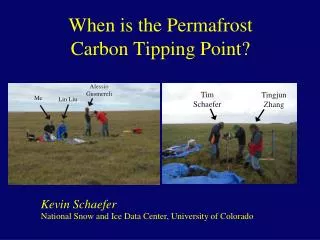
The effect of permafrost thaw on old carbon release and net carbon exchange from tundra. Tuesday, May 24 th 2011. From Nature 459, published May 28, 2009. Alex K Chen and Jinchul Hong. The mean annual air temperature (1980-2005) was -1.0 ºC in Healy,

E N D
The effect of permafrost thaw on old carbon release and net carbon exchange from tundra Tuesday, May 24th 2011 From Nature 459, published May 28, 2009 Alex K Chen and Jinchul Hong
The mean annual air temperature (1980-2005) was -1.0 ºC in Healy, Alaska and the mean annual precipitation was 390 mm. During the study period, (spring 2004-winter 2006-07), annual air temperature was cooler than the mean by 1-2 ºC. Annual precipitation was greater in 2005 (540 mm) and 2006 (472 mm) than the longterm average, but was less in 2004 (324 mm). Permafrost temperatures have been monitored in a 30 m deep borehole in the study area since 1985 (maximum temperature range = -0.7 to -1.2 ºC at 10 m during mid-August)1. During this time frame, researchers recorded rapidly increasing deep permafrost temperatures (by ~0.7 ºC at 10 m) from 1990 until 1998, followed by a more recent slight cooling (by ~0.15 ºC) between 1998 and 20042. Site Location
Alaska Temperature Stable since 1975 • The period 1949 to 1975 was substantially colder than the period from 1977 to 2009, however since 1977 little additional warming has occurred in Alaska with the exception of Barrow and a few other locations. The stepwise shift appearing in the temperature data in 1976 corresponds to a phase shift of the Pacific Decadal Oscillation from a negative phase to a positive phase. Synoptic conditions with the positive phase tend to consist of increased southerly flow and warm air advection into Alaska during the winter, resulting in positive temperature anomalies. • http://climate.gi.alaska.edu/ClimTrends/Change/TempChange.html
Definitions • The eddy covariance (also known as eddy correlation and eddy flux) technique is a key atmospheric flux measurement technique to measure and calculate vertical turbulent fluxes within atmospheric boundary layers. It is a statistical method used in meteorology and other applications that analyzes high-frequency wind and scalar atmospheric data series, and yields values of fluxes of these properties. Such flux measurements are widely used to estimate momentum, heat, water, and carbon dioxide exchange • Gross primary production (GPP) is the rate at which an ecosystem's producers capture and store a given amount of chemical energy as biomass in a given length of time – this is the amount of carbon taken out of the atmosphere • Ecosystem respiration is the production portion of carbon dioxide in an ecosystem's carbon flux – this is the amount of carbon released into the atmosphere. Thus, more respiration means more CO2 into atmosphere. Think of it in terms of this – in human respiration – we exhale CO2. It's a similar thing here • The difference between gross primary production (GPP) and ecosystem respiration (Reco) equals the net ecosystem exchange (NEE) of C
Main point of the study? • Obtain a better estimate of how much carbon in the permafrost could get back into the atmosphere. To do this, we must quantify the amount of old undecayed material in the permafrost • We find that areas that thawed over the past 15 years had 40 per cent more annual losses of old carbon than minimally thawed areas, but had overall net ecosystem carbon uptake as increased plant growth offset these losses. • In contrast, areas that thawed decades earlier lost even more old carbon, a 78 per cent increase over minimally thawed areas; this old carbon loss contributed to overall net ecosystem carbon release despite increased plant growth
How??? • Permafrost is DEEP. The layers down below contain A LOT of stored carbon from decayed organic matter that simply did not decompose due to all the cold. Once the permafrost DEEP DOWN starts to thaw, A LOT of the stored carbon can go up into the atmosphere, causing a positive feedback with temperature • So the purpose of the study is to try to separate out the contributions of the DEEP layers and the SHALLOW layers of the permafrost, since they may release CO2 at different rates • Much of this stored carbon comes from plants. But a lot of it also comes from other organisms too – some of it comes in the form of well-preserved woolly mammoth corpses [and others of course] – and we're starting to discover MORE AND MORE of them in Siberia now that the permafrost is thawing out. And they're going to decay unless we rescue them and store them
Thawing – notice how respiration increases A LOT at the magic point of 0 degrees C. Also notice that the line for extensive thaw has a higher increase (in ecosystem respiration) for each increase in temperature
Also... Winter Months Matter! Overall, C loss during winter accounted for 15–18% of ecosystem respiration (Reco) on average across all sites. Winter C loss was large enough to switch the minimal and extensive sites, which were net C sinks in the growing season, to annual net C sources on average across years (Supplementary Table 2). So why does winter matter? TIME LAG
So where does this time lag come from? time lag in max/min of T is proportional to DEPTH, where time lag = zP/(2pi d) Explained in Cecilia's notes
Where does C14 come from?? • There are three naturally occurring isotopes of carbon on Earth: 99% of the carbon is carbon-12, 1% is carbon-13, and carbon-14 occurs in trace amounts, i.e. making up as much as 1 part per trillion (0.0000000001%) of the carbon in the atmosphere. The half-life of carbon-14 is 5,730±40 years. Carbon-14 decays into nitrogen-14 through beta decay.[3] The primary natural source of carbon-14 on Earth is cosmic ray action upon nitrogen in the atmosphere, and it is therefore a cosmogenic nuclide. However, open-air nuclear testing between 1955-1980 contributed to this pool.
C14 • Also, one of the frequent uses of the technique is to date organic remains from archaeological sites. Plants fix atmospheric carbon during photosynthesis, so the level of 14C in plants and animals when they die approximately equals the level of 14C in the atmosphere at that time. However, it decreases thereafter from radioactive decay, allowing the date of death or fixation to be estimated. • This means, basically, that if we take measurements of the permafrost, and find that our C-14 levels are below that of the ambient atmosphere, then we know that we have run into biological material that hasn't decayed for a long time – because much of the C-14 that was in there had already decayed [ANOTHER TYPE OF DECAY] into N-14 – and this is the old biological material we're looking for • Especially important for deep-soil respiration measurements, since it's VERY hard to get into the deep soil so we know LITTLE about it right now
Thawing => decomposition => more CO2 in atmosphereBut also, thawing => increased plant uptake of CO2. Nonetheless, most of our new plants die within one season so they don't store up CO2 like trees do. • Why measure Delta C-14? Well, we have to ask the question – what is the main point of the paper? It is to attempt a PRELIMINARY quantification of a previous unknown – that previous unknown being the contribution of carbon from undecayed biological material from LONG AGO. Basically, we are trying to quantify the AMOUNT of undecayed carbon that currently exists in the subarctic, so that we can use them as endpoints in our analysis (and then use a weighted sum of the endpoint carbon-14 values – and put them in our models). C-14 allows us to measure the age and RELATIVE PROPORTION of the UNSTORED material so that we can put that in our models (that predict the amount of material down there AND the upper/lower bounds to the amount of material that is deposited down there THROUGH biological processes) and output a BETTER estimation of how much Carbon will get back into the atmosphere • This process (of undecayed material decaying and sending CO2 into the atmosphere) is sort of similar to what we're doing by burning coal and oil. We're transferring stored-up carbon (in the old remains of plants and animals that decayed into coal/oil) into the atmosphere. Here, stored-up carbon is also being transferred into the atmosphere through a natural process (accelerated by humans, of course) • - We have three endpoints: (a) recently decaying biological material [with C-14 ratios SIMILAR to background levels], (b) material from the 1950s [with MUCH higher ratios thank to bomb tests], and (c ) material from CENTURIES ago [with much LOWER ratios since they haven't decayed for a LONG time – although their C-14 did decay]
Notes on Delta Carbon Measurement • Radiocarbon Δ14C • The formula for determining the Δ14C of a sample is similar to δ13C: • Δ14C = [FN[x] -1] x 1000 • The difference is in the term FN[x], which is still a comparison of the sample to a standard. However, after this comparison, several other calculations occur to find FN[x]. • The ratio is corrected for “background” 14C counts (see next slide), where atoms or molecules that were accidentally and incorrectly identified as 14C are no longer included. • The ratio is additionally corrected for the small amount of radioactive decay between the time the sample was collected and the time it was measured, so that the Δ14C at the time of collection rather than the time of analysis is reported. • The final difference is that Δ14C is normalized, where the effect of fractionation is removed. That is, we know from the 13C measurements that, for example, when carbon dioxide is photosynthesized by plants, it fractionates, resulting in proportionately less 13C in the plant. The same thing happens to 14C, so plants have proportionately less 14C than the atmosphere does. If we know how much 13C fractionation occurs, we can calculate precisely how much 14C fractionation there is. We then calculate how much 14C would have been in the sample if it had not fractionated. This is the Δ14C. Why go to all this trouble? The main reason is that for radiocarbon dating, scientists want to study how much 14C has decayed, not how much has fractionated, and this normalization allows them to do just that. The second reason is that it makes it easier to understand the 14C in the atmosphere – now when plants photosynthesize CO2, the Δ14C value in the atmosphere does not change. Of course, we can always reverse the calculations to discover the amount of 14C without applying this normalization, and this is written as δ14C. • http://www.esrl.noaa.gov/gmd/outreach/isotopes/deltavalues.html
Carbon=>Atmosphere Calculations – Are our observed projections extendable to the future? Probably not Carbon loss projections are based on the assumption that the observed three-year average fluxes are representative of longer time periods, and can be extrapolated into the Future. However, this assumption is probably wrong What does this mean? It means that in the FUTURE, we can expect GREATER fluxes of carbon into the atmosphere BECAUSE the zone (in depth) of thaw will increase with more thawing in the future. We simply don't know enough about the deep permafrost layers (after all, it's hard to drill into, and we're only measuring a PART of it in Alaska – the biological material in Alaska is DIFFERENT from the material in Siberia or Scandinavia)
Also..(quoted from paper) • Our observations do not account for future thawing and active layer • thickening that will expose a larger pool of permafrost C to decomposition. Also, net • exchange of CO2 does not account for hydrologic C losses or methane emissions Also, it is known that upland and lowland sites may differ in the release rate of CO2 and methane (CH4), depending on whether aerobic or anaerobic decomposition predominates29,30. While these gases have different greenhouse warming potentials (GWP), recent calculations have suggested that the overall climate effect of thawed permafrost C decomposition is actually similar between aerobic versus anaerobic environments31. This is because total C emissions are lower from anaerobic environments, but are compensated by the higher GWP of methane
Permafrost Source: THE FROZEN EARTH FUNDAMENTALS OF GEOCRYOLOGY ,