Download
1 / 24
240 likes | 343 Views
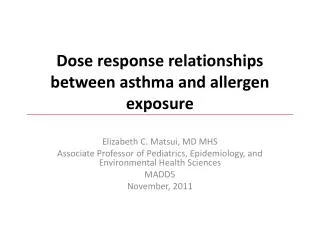
METHODS FOR DETERMINING SIMILARITY OF EXPOSURE-RESPONSE BETWEEN PEDIATRIC AND ADULT POPULATIONS. Stella G. Machado, Ph.D. Quantitative Methods and Research Staff Office of Biostatistics/OPASS/CDER/FDA CLINICAL PHARMACOLOGY SUBCOMMITTEE MEETING NOV 2003. ACKNOWLEDGEMENTS.

E N D
METHODS FOR DETERMINING SIMILARITY OF EXPOSURE-RESPONSE BETWEEN PEDIATRIC AND ADULT POPULATIONS Stella G. Machado, Ph.D. Quantitative Methods and Research Staff Office of Biostatistics/OPASS/CDER/FDA CLINICAL PHARMACOLOGY SUBCOMMITTEE MEETING NOV 2003
ACKNOWLEDGEMENTS • Substantial contribution from my colleague Meiyu Shen • ideas from Yi Tsong, James Hung, Donald Schuirmann, Scott Patterson, Walter Hauck and Sharon Anderson, Peter Lee, C. Naito, K. Akihiro, and many others.
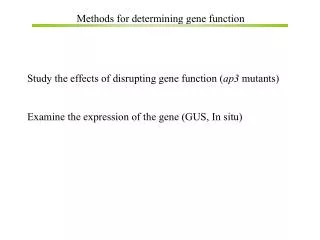
INTRODUCTION • General method described for comparing PK/PD response curves in 2 populations: • Pediatric versus Adult populations • Other population groups, eg, ethnic region, gender • Exposure: dose, AUC, Cmin, etc • Response: biomarkers, clinical endpoints
BRIDGING PK/PD STUDIES • Goal is to evaluate similarity in PK/PD relationships in Adult (original) and Pediatric (new) Populations • Conclude • similarity • similarity with some dose regimen modification • lack of similarity • Absence of precise guidance as to how this should be done • Exploratory, not confirmatory, approaches needed
DRUG X • Scatter plot of Y vs. C for 2 populations • How to establish similarity?
STEPS IN THE STATISTICAL APPROACH • Suppose data from Original and New Populations: • original (adult): n0 patients, measure Y and C • new population (pediatrics): n1 patients, measure Y and C • concentration measurements generally different, unless data from concentration controlled trial
STEPS IN THE STATISTICAL APPROACH • PK/PD response curves: • to establish similarity, need to compare the average shapes of response curves, taking account variability • response curve Y depends on exposure C, and unknown parameters : Y = f(C, ) • may have different parameters in the two populations
STEPS IN THE STATISTICAL APPROACH • assess similarity between responses at all concentrations likely to be encountered • distance between the curves – shape comparison • account for variability of the response • need “Equivalence” type approach, not hypothesis tests showing that the responses are not significantly different
HYPOTHETICAL:SIMPLEST SITUATIONfocus on single exposure C • Reduces to usual equivalence-type analysis approach • Response metric of interest for comparison could be: • average response at every exposure C • combination of average and variance of response at each C: like FDA-PBE or Kullback-Liebler distance metrics or • whole distribution at each C – Kolmogorov-Smirnov generalization • Choose here to look at average response
All C’s identical, continued • Usual equivalence-type analysis: • can define “similarity” to be requirement that the average responses in the 2 populations, at the same C, are closely similar: • choose “goalposts” L and U, eg 80% to 125% • calculate 95% confidence interval for ratio of average responses (1 / 0) ( = mean or average response)
All C’s identical, continued • If 95% confidence interval of ratio 1 / 0 falls entirely within interval (L, U), then null hypothesis of lack of equivalence is rejected. • This corresponds to “simultaneous two one-sided test procedure for equivalence”, carried out at level = 0.025. • Proposal: use confidence intervals to measure “similarity” and to quantify what was actually determined from data in the 2 populations
Estimation of 95% confidence interval for ratio 1 / 0 • some work required - methods in literature • easier: use bootstrap method from observations, or computer simulation • for decision-making, can make useful statements, such as, for example, • “the average response to concentration C in the New Population is about 93% of that in the Original Population, and we are 95% confident that the ratio of the averages lies between 83% and 105%”
SITUATION: MANY VALUES OF C • First approach: • Categorize values of C into intervals: (C1, C2), (C2, C3), (C3, C4), etc • For each interval, (Ci, Ci+1), estimate 95% confidence intervals for 1i / 0i and interpret. • Interpret responses graphically, for all categories of C.
Drug X: 95% CI’s for ratios 1/0 for concentrations: 0, 0-40, 40-60, 60-80, >80
Comment on Graph • ratios trend upwards from 1.0 as C increases: New population has greater average response than Original population • upper limits of 95% CI’s exceed 1.25 for all exposures
SITUATION: MANY VALUES OF C • Second approach: model-based . Fit models: • 0(C) = f(C, 0) • 1(C) = f(C, 1) Estimate the unknown parameters: ’s, variances. Use fitted model to simulate 0(C), 1(C), for as many values of C as desired: estimate the ratios of the average responses: 1(C)/0(C) estimate 95% CI’s from percentiles of ratios
EXAMPLE: Drug X • Response transformed by square root to stabilize the variance • Linear models were fitted separately for the two populations • sqrt(response) = a + b * Conc + • For each C, 5000 pairs of studies were generated 5000 estimates of 1/0, and percentiles
DRUG X: 95% CI’s for ratios 1/0 for concentrations: 0, 20,50,70,90 via model-based method
DRUG X: COMPARISON OF 2 APPROACHES 95% CI’s for 1/0 from Categorized C’s (1st in pair) and Model-based method (2nd in pair)
Comparison of approaches • model based method: • less influenced by outliers • generally greater precision • both useful
DESIGN CONSIDERATIONS for studies in New Population • based on parameter estimates from Original Population and any prior information from New Population • include doses likely to produce C’s in the whole range of interest • perform simulations to assess robustness to model assumptions, variability of parameter estimates, choice of doses, to determine required number of patients needed in new population
OCNCLUDING REMARKS • efficacy vs. safety • proposed method for quantifying the similarity between Original and New Populations over whole range of concentrations likely to be encountered • applies to data from trials with different designs • usual goalposts such as (0.8, 1.25) may not be meaningful for the drug (therapeutic range) and disease - interpretation of how much similarity is needed requires medical input.