Download
1 / 23
230 likes | 309 Views
Probabilistic Forecasts of Hurricane Surges. Motivation – expensive but critical operations are (will be) made in Hurricane Protection System Thresholds – depend on many factors and can vary significantly throughout a region Economics – these decisions can be highly influenced by cost.

E N D
Probabilistic Forecasts of Hurricane Surges • Motivation – expensive but critical operations are (will be) made in Hurricane Protection System • Thresholds – depend on many factors and can vary significantly throughout a region • Economics – these decisions can be highly influenced by cost
Considerable progress in predicting hurricane intensity over the last 20 years – 50% over last 20 years.
Cross-track & Along-track Error Along track error std. dev is higher than cross track error. Avg error: Along track = 80 nmi Cross track = 65 nmi • The error envelope is really an ellipse, not a circle. • NHC is better at forecasting where a storm is heading than forecasting when it will get there. Hurricane Forecasting Errors | June 2010 GNOBR Meeting | Matt Barrows 3
Landfall error may be correlated with the variability of the predicted tracks from different models; but this relationship has not been quantified.
a) = 72 hour forecast b) = 48 hour forecast c) = 36 hour forecast d) = 24 hour forecast
BUT, little or no progress in predicting hurricane intensity over the last 10 years.
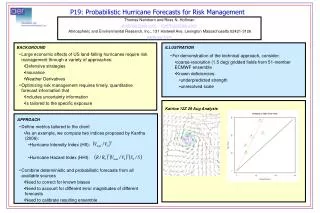
If we let xi be the probability of a parameter value given the deterministic forecast value, i.e. Then: yields a good estimate of the statistical forecasts characteristics
Special note: • The SELA area contains • 3 different types of • responses: • West-Bank type • East of delta type • L. Pontchartrain type Although the overall pattern has shown considerable organization in the “along-coast” direction (Resio, et al, 2008 – Nat. Haz; Irish et al., 2008, Nat Haz; Irish and Resio, 2010 – Ocean Engr), the residual variability is fairly high at individual points.
Also, as discussed in Niedoroda et al, 2010, the spacing between the storm tracks creates a (small) superficial pattern in the along- coast estimates in the statistical storm characteristics, To remove spurious variations along the coast, it is necessary to estimate maximum values between the 5 fixed values and to use a fine-scale integration variable. Fitted Maximum Value Linearly Interpolated Maximum Value Linearly interpolated values could be a as much as 1 to 2 feet lower than the “fitted” maximum values at points between tracks.
Overall method for obtaining “small-increment” estimates • of surges as a function of 5 parameters: • Along-coast function finds “fitted” max-s before interpolations • Radius to maximum wind function uses published function in extrapolations • (still interpolated between actual data points but should be adjusted for Lake Pontchartrain) • 3. Pressure deviation function is still taken as linear in interpolation/extrapolation • 4. Track angle function is fitted by regression • 5. Storm speed uses published adjustments for speed variations
IHNC 1 (Q305) Central Pressure = 955 mb Reference Longitude = 90 degrees
IHNC 1 (Q305) Central Pressure = 930 mb Reference Longitude = 90 degrees
IHNC 1 (Q305) Central Pressure = 905 mb Reference Longitude = 90 degrees
Deterministic Forecasts: 960 mb – 10.8 ft; 930 mb – 15.3 ft; 905 mb – 18.2 ft Percentage of Incorrect Decisions for a 15-ft Threshold Black denotes taking an action that should not have been taken. Red denotes not taking an action that should have been taken. Percentage of Incorrect Decisions for a 10-ft Threshold Black denotes taking an action that should not have been taken. Red denotes not taking an action that should have been taken.
Points • Significant gains can be made by developing fast-response methods for operations rather than traditional (slow) methods • Information without measures of uncertainty does not meet some critical needs for USACE • All factors that are important to accurate hindcasts for risk are important to forecasts which incorporate uncertainty
Incorporation of Uncertainty into Extreme Extremes • NRC-related work
Comparison of Estimated Central Pressures with and without Uncertainty