Candlestick patterns in Share market trading
220 likes | 1.71k Views
know all candlestick patterns and the market psychology of the main candlestick patterns used in share trading. Understand the price that why the top candlestick patterns like a hammer, and bullish engulfing pattern are made in the market. Also, check the forecasting of the nifty 50 and dow jones with the candlestick pattern analysis.<br><br>https://www.tradersmantra.in/candlestick-patterns/<br>

Candlestick patterns in Share market trading
E N D
Presentation Transcript
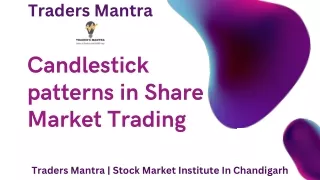
Traders Mantra Candlestick patterns in Share Market Trading Traders Mantra | Stock Market Institute In Chandigarh
Candlestick patterns in Share market trading know all candlestick patterns and the market psychology of the main candlestick patterns used in share trading. Understand the price that why the top candlestick patterns like a hammer, and bullish engulfing pattern are made in the market. Also, check the forecasting of the nifty 50 and dow jones with the candlestick pattern analysis.
Candlestick patterns in the share market are the same as the road signs on streets while driving a vehicle. Patterns can give you a sense that when the price is about to increase momentum or when to make a U-turn. To understand the Candlestick pattern in depth, we should go a little into the discovery of those patterns. Let’s start with the legend who introduced these candlesticks patterns in the price action chart. Candlestick patterns in Share Market Trading
Types of candlesticks from which the patterns are formed Green candle with a single wick Green candle with both sides wicks Green candle without a wick Red candle with a single wick Red candle with both sides wicks Red candle without a wick Without body, a single wick Without body, both sides wick
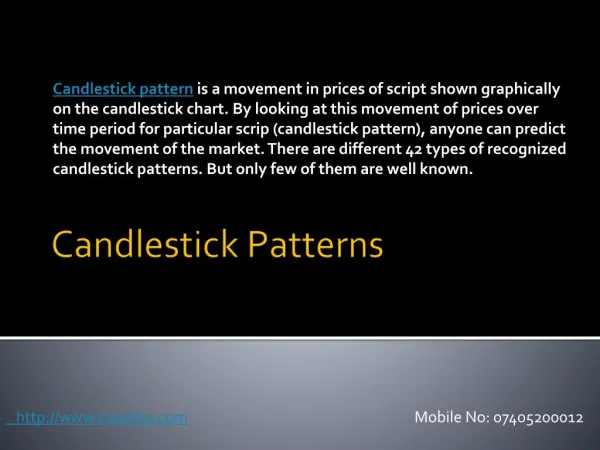
Candlestick patterns are basically based on the movement of price on graphical charts. Candlesticks together make different types of patterns which help to predict the movement of price in a direction. After completing a particular pattern, the price mostly behaves the same as its historical data. These patterns are the footprints of price movements which helps us to forecast the action of the price at a certain level. Although Candlestick patterns show the Greed and Fear of the market participants. What are the candlestick patterns?
13 best candlestick patterns used in the share market There are more than 45 candlestick patterns found in the Stock market, which I have listed below in the article. The main candlestick patterns which are more reliable in share market trading are written below.
Morning star The morning star consists of three candles. It can be found in a downtrend. The first candle is bearish as it represents the ongoing bear trend. The second candle is a small candle which stays near the bottom of the first candle. Evening Star The evening star also consists of three candles. It is usually found in an uptrend. The first candle which is in the direction of the trend i.e. bullish closes with a green candle.
Bullish Engulfing Candlestick Pattern Bullish engulfing candlestick made with two candles. The first candle is in the direction of the trend i.e. bearish. The turning table is the second which opens below the close of the first candle but engulfs the entire previous one. Bearish Engulfing Candlestick Pattern A bearish engulfing candlestick is also made with two candles. Alternate to the bullish engulfing, the first candle is in the direction of the trend i.e. bullish. The turning point is shown by the second candle which opens above the close of the first candle but closes down to the previous candle.
Doji candlestick Doji candlestick pattern is the formation of a small body or no body in between and long wicks on the upside and downside of the candlestick. It closes exact or near where the open is formed. Dragonfly Doji pattern In a downtrend, when the price after opening without moving a tick upward, goes down but covers all the down move within the same candle, it is known as Dragonfly Doji.
Gravestone Doji pattern In an Uptrend, when the price after opening without moving a tick downward, goes up but coves all the up move within the same candle, it is known as Gravestone Doji. It has a long wick to the upside with a tiny body without a body at the bottom of the candle.
Hammer candlestick pattern Hammer appears green or red small body in colour has a long wick on the downside showing the opening and closing of the candlestick. It forms in the downtrend and represents the temporary bottom of that downtrend. Inverted hammer candlestick The inverted hammer appears in green or red colour small body having a long wick to the upside showing the opening and closing of the candlestick. It also forms in the downtrend and represents the temporary bottom of the prior downtrend.
Hanging Man A candlestick with a long wick to the downside having a small body at the top appears in an uptrend is Hanging man. It gives a good look of a hanging man in the chart. Shooting Star This candlestick is of a long wick to the up but has a small body of green or red colour. Specification: The wick to the upside should be long and the colour of the body doesn’t matter.
Piercing bullish pattern In a downtrend, the pattern combines two candlesticks in which green (bullish) appears after a red (bearish) one with a gap-down opening and retracement closing of more than 50%. Dark cloud cover In an uptrend, the pattern is a combination of two candlesticks in which a red (bearish) candlestick appears after a green (bullish) one and opens a gap up but closes retracing the first one by more than 50% mostly near the top which shows the momentum is shifting towards the downside and it can be a trend reversal.
List of all candlestick patterns There are a total of 49 candlestick patterns. Here is the list of all candlestick patterns in the Stock market.
Psychology of candlestick patterns The question usually arises in the mind of a trader or an investor is why candlestick patterns show a great level of accuracy. It is because of the psychology of the price hidden behind the price action. Candles give the open, close, high and low data of a particular timeframe. At a very particular timeframe, if the price is planning to reverse, it shows some signal which is most of the time a true signal. Candlestick patterns are highly reliable in which timeframe? Candlesticks are available on technical charts in almost every timeframe including second, minute, day, week and month. You can use any one of them for trading but when it comes to the reliability of the patterns; the higher the timeframe, the more the reliability. As the price fluctuates up and down every single second during live market hours, it is quite difficult to handle the noise of small timeframes which somehow can affect your trading psychology.
Candlestick patterns with other indicators No doubt candlestick patterns have in itself high reliability. Candlestick patterns with the support and resistance Check if the candlestick pattern is formed at the previous support or the resistance of the price. This can give us a confirmation as the price shows much accuracy to take a turn with the double confirmation.
Candlestick patterns with the moving average When the price touches the moving average and forms a reliable candlestick pattern, it is also the best time to make a trade as the price is confirmed in a double way. Candlestick patterns with Elliott wave theory If you are familiar with the Elliott wave theory, wave 2 and wave 4 are good dips which give a trader a very good opportunity to buy.
Candlestick patterns with RSI divergence In the positive divergence of the RSI, the price most of the time forms a hammer, bullish engulfing or the morning star. Candlestick patterns with volume confirmation With any bullish signal of the candlestick pattern, if the volume is high as compared to previous candles, it is a good sign to buy.
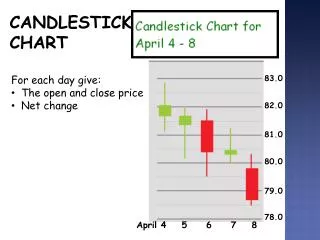
Chart Analysis with candlestick patterns Nifty Daily Chart Dark cloud Candlestick Pattern Analysis Here we analyse two charts which can help you understand how to analyze the price with candlestick patterns. As we can see in the chart below, the last candle of the daily timeframe in Nifty 50 engulfs 50 % of the previous bullish candle.
Dow Jones Industrial Average Index chart Evening Star Candlestick Pattern In the chart of the Dow Jones Industrial Average below, the latest three candles are forming an Evening Star candlestick pattern. In an uptrend, the bullish candle is paused by the second last candle, which is also a shooting star in itself.
Get In Touch Email tradersmantra90@gmail.com Phone +91 8837793811 +919988766654 Address Space Jam, SCO 50-51, 3rd Floor, Adjacent to Mukat Hospital Sector 34 A, Chandigarh - 160022
Thank You Traders Mantra | Stock Market Institute In Chandigarh BY Traders Mantra Team