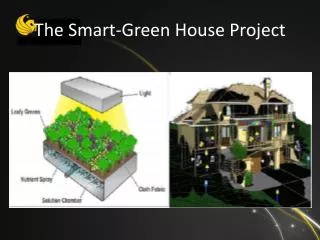
The Smart-Green House
1.47k likes | 5.3k Views
The Smart-Green House. Group 1: Rafael Abreu Danny Gonzalez Kaltrin Gjini Richee Ramsahoye. The Smart-Green House. Home automation taken to the next level The Smart-Green House Project offers: Power outlet calibrations Creation of a timed schedule for managing the house

The Smart-Green House
E N D
Presentation Transcript
The Smart-Green House Group 1: Rafael Abreu Danny Gonzalez KaltrinGjini RicheeRamsahoye
The Smart-Green House • Home automation taken to the next level • The Smart-Green House Project offers: • Power outlet calibrations • Creation of a timed schedule for managing the house • Growth and maintenance of plants based on water and lighting specifications
Goals and Objectives • Create a smart customizable system to control a house • Create a system to aid in the growth and upkeep of plants with little to no waste of light and water • Make it user friendly with a minimal learning curve • Low cost • Low power consumption
Specifications • 5 voltage limit for user interface • 25 volt power supply for Green Unit System • Weight limit is constrained to be 65 lbs • 500 Watt limit for power consumption • $420 budget for entire project
Growing System Richee Ramsahoye
Growing System • The growing system will use an aeroponics approach for nurturing the plants • Aeroponics is a growing method in which the roots of the plants are hanging in the air. • This will increase the efficiency of use of resources among the system • The system will consist of a sprinkler system with a sprinkler nozzle to distribute the nutrients solution, an LED light source to trigger photosynthesis, and a water refilling system to refill the reservoir
LED Light Source • LED light source will be made by hand in an arrangement that adhere to the goals of keeping the cost of materials and the power consumption low while triggering photosynthesis as efficiently possible • With these goals, the LEDs are cascaded in series into multiple parallel branches • The LEDs to be used are red(~630nm) and blue(~470nm) • Proposed Design uses 7.93 to 12 Watts • Blue LEDs • Maximum Forward Current: 20mA • Voltage Operational Range: 3.5V – 4.5V • Red LEDs • Maximum Forward Current: 30mA • Voltage Operational Range: 1.7V – 2.6V
Circuit uses 50 Red LEDs and 40 Blue LEDs • Current is controlled by the series resistor on the end of each branch • Amount of Blue LEDs are reduced because they produce more light than the Red LEDs
Nutrients Detection System •This system will measure the electro-conductivity of the water within the reservoir •This will result in the amount of nutrients that are present within the water •Since the electro-conductivity of the water is essentially the resistance of the water, the electro-conductivity can be calculated like a resistance with respect to the geometry of the probe •Equation to calculate Electro-Conductivity of Solution with respect to the resistance: R= l/A p •With this equation, the resistance of the solution can be determined and therefore, the voltage gain from the amplifier will give the effective resistance of the solution •This equation will determine the geometry of the probe and the conductance of the element
Nutrients Detection Schematic • Positive gain amplifier where the probe is treated as the input resistor • This will result in a voltage amplification with the gain being affected by the resistance of the probe • This voltage will lead into an rectification circuit to give the effective resistance of the water and leads into a comparator • The Preset Voltage is user specified and will determine if there needs to be more nutrients to be distributed into the reservoir
Nutrients Distribution System • The comparator from the Nutrients Detection System will return a positive voltage if the nutrients needs to be distributed • Thus, a voltage regulator is used to turn on and power the solenoid valve which will start to distribute the nutrients concentration into the reservoir • If the comparator returns a negative voltage indicating there is enough nutrients, the voltage regulator will be off thus shutting the solenoid valve off as well
Water Refilling System • System will work as a means to fill the reservoir when there is an insufficient amount of water • Probe will be used to close the circuit indicating that the reservoir is at an acceptable level • Uses an inverting amplifier configuration to amplify the voltage from the probe • Amplified voltage leads into a comparator which will output the difference with the preset voltage • Output from the comparator already serves to power the solenoid when the probe is opened • When probe is closed, the voltage from comparator will ideally be zero • If the voltage is insufficient to power the solenoid valve, the reservoir will be at an acceptable level. • Accuracy is not a key factor for this part of the design
Central Control Unit/ User Interface Kaltrin Gjini
Purpose • Purpose of the central control unit is to have a physical button interface to control the sensors near the plant. • The button interface allows the user to go through all the sensors and find problems if present. • Also has inputs to allow for connections to sensitive areas where knowing if electric power flowing is important. • It is: low cost, efficient in power consumption, and easy to use.
Design of Central Control Unit • There are 8 inputs with 10 outputs. • Overall power use of central control unit is below 30 W. • It is logic based, sending a high turns the selected I/O unit on and a low turns it off. • Input allows for varying voltages depending on application.
Design of Button Interface • There are 10 on/off buttons for switching. • Button for counting up and down through sensors. • R/W button for reading or writing to a sensor. • Dimensions: 7cm x 12cm for the board, counter buttons 0.5 cm in diameter, and On/Off and R/W at 1 cm in diameter.
Button Interface Allocated areas for buttons.
Wireless Control Unit Rafael A. Abreu
What is the Wireless Control Unit? Its used to: • Automatically turn devices on/off • Measures watts of the operating device • Control Power Phase Output to Load
Specifications •Weight less than 2lb •Max Power measure 1800W •Power Measurement accuracy of ±3% •Dimension less then: L- 6" W- 3" D-2.5 " •Communication Range up to 90ft
Power Supply •LM7850C Linear Voltage Regulator: -Output Range 5V -Output Current up to 1.5A -Internal Short-Circuit Current Limiting
Sensor for Calculating Power ACS756 Hall-Effect Current Sensors
Controlling Power Microcontroller Zero-Crossing
Software & Communications Danny Gonzalez
Wireless Communications • The wireless technologies we considered were ZigBee, Bluetooth and Wifi (802.11), CDR03A module and arduino Ethernet shield. • CDR03A and the Arduino Ethernet shield were the best wireless communication technology available based on price, compatibility and range • Good amount of sample PHP and Arduino code available • Wireless internet connections will be required in order to connect the user with the board controlling the features.
Software Overview • Arduino C modified language. Will be used to program the chips and the Ethernet shield. • JavaScript, html, css, PHP will be used on the website
Testing • Power consumption was measured at 40 watts with respect to 0 load • All pumps are fully functional and valves were checked for leaks • Button Interface was tested at every load input/output • Wireless Control System was tested for range • Tested at 100 feet with no interference