Earned Value Analysis
Earned Value Analysis. Cost Planning Cost Control Cost Reporting. €1. €1. €1. €1. €1. progress at milestone 1:. €1.50. €2.50. Earned Value Analysis. the original plan. BAC = Budget At Completion = €5. EV = €2. Only 2 tasks; both overspent.


Earned Value Analysis
E N D
Presentation Transcript
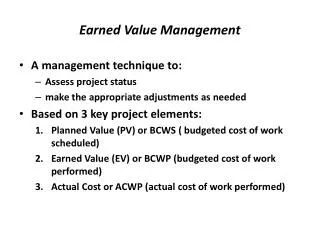
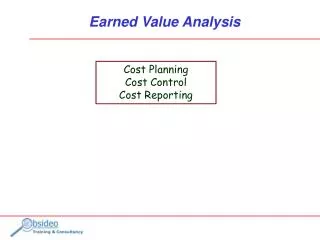
Earned Value Analysis Cost Planning Cost Control Cost Reporting
€1 €1 €1 €1 €1 progress at milestone 1: €1.50 €2.50 Earned Value Analysis the original plan BAC = Budget At Completion = €5 EV = €2 Only 2 tasks; both overspent. We had planned to do €3 of work, but only ‘earned’ €2. Unfortunately it cost us €4 to do it. We can use the power of EVA to forecast the future…
Earned Value Analysis If you, in the role of project manager, convince your customer that the project will cost xxx, and you also cost each task or major milestone along the way, then in the customer’s mind each task or milestone will be worth what you said. So if you are so poor at controlling the project that a task has cost you twice the original estimate why should the customer pay for your incompetence? This is the essence of EVA; you will only earn what the customer sees as the value of task. Many large organisations pay their contractors in this way
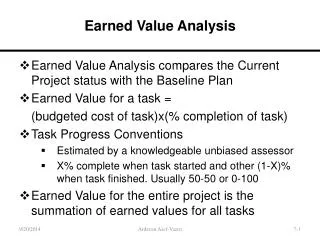
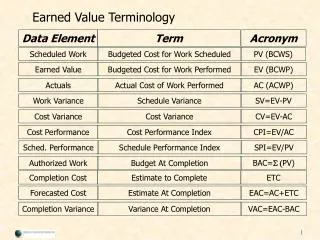
From the original estimates Earned Value Analysis – Jargon - 1 EV is Earned Value EV = €2 PV is Planned Value PV = €3 AC is Actual Cost AC = €4 Earned Value means the total value of the tasks we have actually completed by this time Planned Value means the total value of the tasks we had meant to complete by this time Actual Cost means the total cost we have incurred getting to this point in time
EV is less than AC We have spent more than we have earned AC is less than EV We have earned more than we have spent PV is less than EV We have earned more than we had planned PV is less than AC We have spent more than we had planned So What? – 1 IF:…
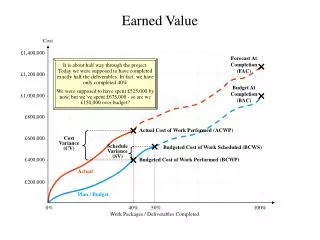
AC EV This poor performance could have been identified here… The Graphs cost PV The Actual Cost is running ahead of the Planned Value, therefore the project is over budget The Earned Value is running behind Planned Value, therefore the project is behind schedule time
CV is Cost Variance; CV = EV - AC CV = 2 - 4 = -2 SV is Schedule Variance; SV = EV - PV SV = 2 - 3 = -1 Earned Value Analysis – Jargon - 2 We can look at variance: A negative variance is BAD…
CPI is Cost Performance Index; CPI = EV/AC CPI = 2/4 = 0.5 EAC is Estimate At Completion; EAC = BAC/CPI Warning: may be a naive assumption:… EAC = 5/0.5 = 10 Earned Value Analysis – Jargon - 3 We can extrapolate from the current position:…. Everything we do seems to cost us twice what we had planned:…
EAC = AC + Remaining PV EAC = AC + (BAC-EV) EAC = 4 +(5-2) = 7 EAC is Estimate At Completion; EAC = BAC/CPI EAC = 5/0.5 = 10 So What? - 2 This is only true if all future tasks overrun at the same rate as now. If we think we have fixed the problems behind the current cost overrun then a better EAC formula is:… This is a much smaller EAC, but remember our premise…
EAC is Estimate At Completion; EAC = BAC/CPI ETC = EAC - AC ETC = 10 – 4 = 6 EAC = 5/0.5 = 10 Earned Value Analysis – Jargon - 4 The EAC is obviously a really important figure in the overall cost control for the project, but there is another figure that many people will want to know:… ETC is Estimate to Complete, meaning how much more money will it take to finish this project. ETC is easy to compute.
EV = €2 PV = €3 AC = €4 CPI = 2/4 = 0.5 SPI is Schedule Performance Index; SPI = EV/PV SPI = 2/3 = 0.66 Earned Value Analysis – Jargon - 5 More extrapolation, albeit slightly more risky. We know that every task we have finished seems to be taking longer than planned, so maybe we can infer that all future tasks will overrun their schedule by a similar amount. This means we can calculate a Schedule Performance Index, as follows: So if the original duration was 5, the new duration could be: OD/SPI = 5/0.66 = 7.6
1.2 1.1 1.0 0.9 0.8 Earned Value Analysis • EVA can be a powerful tool for forecasting outturn • it requires accurate estimating as well as control • It assumes future cost performance will be similar to current Upper Control Limit Lower Control Limit
Classroom Practice - 1 All figures are cumulative 1. What is the CPI at the end of month 4 2. What is the SPI at the end of month 4 3. What is the EAC at the end of month 4 4. What is the ETC at the end of month 4
Classroom Practice - 2 All figures are cumulative 1. What is the CV at the end of month 4 2. What is the SV at the end of month 4 3. If all the work completed in Month 4 fails quality testing, and has to be reworked in Month 5, meaning that none of Month 5’s tasks can be completed: 3a. What is the EV at the end of month 5 3b. What is the AC at the end of month 5 3c. What is the CPI at the end of month 5