Download

1 / 44
440 likes | 604 Views
Instrumental Variables Models. Patsi Sinnott, PT, PhD March 2011. Outline. Causation Review The IV approach Examples Testing the Instruments Limitations. Causality Review. Randomized trial provides the structure for understanding causation Does daily dark chocolate affect health?

E N D
Instrumental Variables Models Patsi Sinnott, PT, PhD March 2011
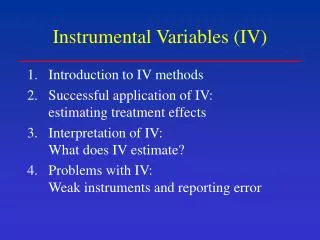
Outline • Causation Review • The IV approach • Examples • Testing the Instruments • Limitations
Causality Review • Randomized trial provides the structure for understanding causation • Does daily dark chocolate affect health? • Does rehab reduce long term costs of care in patients with THR/TKR?
Randomization Treatment Group (A) Outcome (Y) Random Sorting Recruit Participants Comparison Group (B) Outcome (Y)
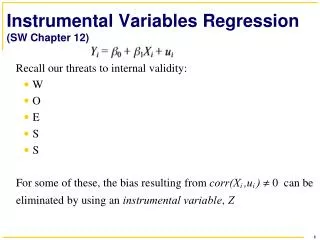
Randomization • In OLS (yi = α + βxi + εi ) • The x’s explain the variation in y • ε = the random error • Randomization assumes a high probability that the two groups are similar
OLS Assumptions • Right hand side variables are measured without noise (i.e., considered fixed in repeated samples) • There is no correlation between the right hand side variables and the error term E(xiui)=0
However • Randomized trials may be • Unethical • Infeasible • Impractical • Not scientifically justified
Observational Studies • Natural Experiment • Administrative Data • Observable characteristics (e.g. age, gender, smoking status) can be included in the model, BUT……. • Treatment (sorting) is not randomly assigned • All characteristics are not likely to be “generally” evenly distributed
Potential violation of OLS assumptions • Explanatory variables are not fixed in repeated samples • Regressors are correlated with the error term (endogeneity)
Violations occur ….. • Measurement error in the explanatory variables • Autoregression with autocorrelated errors • Simultaneity (and reverse causation) • Omitted variables • Sample selection (in the population because of some unmeasured characteristic)
The IV approach • Assumptions for the instrument • Causes substantial variation in the problematic variable • Independent • No direct or indirect effect on the outcome
Instrumental Variable • Cause variation in the variable of interest • No direct or indirect effect on the outcome Instrumental variable Treatment Outcome Other variables
Example • Wage = fn(years of education)
Whiteboard • What’s missing (wage=fn (years of education)
Example • School performance = fn (class size)
Whiteboard • What’s missing: School performance = fn (class size)
Example • Mortality after AMI = fn (cardiac cath.)
Whiteboard • Mortality after AMI = fn (cardiac cath.) +
The IV approach • School performance = fn (class size) + parent involvement • Wage = fn (years of education) + ability • Mort. after AMI = fn (cardiac cath) + other var.
IV (Omitted variable) • Wage = fn (years of education) + ability • Instrument influence years of education but not ability (error term) • Distance to nearest college – related to years of college (not ability)
IV (Sample selection) • School performance = fn (class size) + parent involvement • Class size • Dummy variable (split class due to enrollment changes) • Captures effect of smaller classes (without other unmeasured characteristics of students/parents associated with smaller class size)
IV • Mortality after AMI = fn (cardiac cath.) + other var. • Instrument affects likelihood of cath. • No direct effect on mortality • Differential distance to nearest cath. hospital
Example • Does more intensive treatment of AMI in the elderly reduce mortality (McClellan; McNeil; Newhouse. JAMA. 9/21/94)
McClellan, McNeil and Newhouse • Preliminary results • 23% w/AMI received catheterization • Year 4 – 2/3rd of those who did NOT receive cath had died (compared to 30% of cath group)
Results • 37% points difference in mortality at 4 years in unadjusted • 28% points difference with observable characteristics (age, gender)at 4 years (OLS) • 7 percentage point difference in 1-day mort • 13 percentage point difference at 7 days • 18 percentage points at 30 days
IV for cath rate • Differential distance between nearest hospital and nearest catheterization facility/hospital • Pts w/AMI will go to nearest hospital • Distance from nearest hospital to nearest cath hospital will be independently predictive of catheterization for similar patients.
IV for cath rate • Zip code center to Zip code center • If nearest hospital = cath hospital then DD = 0 • Differential distance to cath hospital • ≤2.5 mi. and > 2.5 miles
Results w/DD IV • That variation in IV causes variation in the treatment variable (cath) is satisfied • (26.2-19.5 = 6.75% point greater chance of getting cath within 90 days following AMI) • That DD affects outcomes only through likelihood of receiving treatment • reasonability
Results w/DD IV • Patient characteristics appear balanced • Hospital characteristics not
Multiple regression results • Patient characteristics • Hospital IVs including high volume hospital (1,0), rural residence (1,0) • DD IV
Multiple regression w/IV results * In percentage points, standard errors in parens.
Summary of results • Unadjusted – 37 % age pt effect on four year mortality • Adjusted w/out IV – 28 % age pt effect • Adjusted w/DD IV – 6.9 % age pt effect • Adjusted with DD, high volume hospital and rural IVs – approx 5 percentage pts. • The 5% age pt. difference at day 1
Inference • RCT provides the average effect for the population eligible for the study • Simple IV estimator • Effect of cath = ∆mortality/ ∆ cath rate = • =(58.06-58.02)/(26.2-19.5) = • -0.46/6.7 = -0.069 • That the 6.7% of patients who rec’d cath at nearby hospital had on average 6.9% percentage point additional chance of 4 year survival
Inference • Wide angle view of the effects of treatment • More general population than RCT • External validity • Marginal effect on a selection of the population: • Problematic for clinicians • Policy implications – incremental effects
Testing for strength of the instrument • Tells a good story • Validity of overidentification • Does the instrument have the expected sign and is significant • Compare to alternative instruments (if available)
Testing • Defend assumption that instrument is NOT an explanatory variable • Explain why instrument is not correlated with omitted explanatory variable
Testing • Test if errors are correlated with regressors • Hausman test • Test if instrument is uncorrelated with the error • Sargan test
Testing • Test if the correlation between the instrument and the troublesome variable is strong enough • F statistic, regressing troublesome variable on all instruments – to test the null that the slopes of all instruments equal zero • Staiger Stock test
Conclusion • Instrumental variables mimic randomization • But good instruments are hard to find. • An estimate of the marginal effect/influence on outcome
Other IV methods • Randomization • 2SLS