Download

1 / 2
20 likes | 150 Views
Validation of a Multi-Year Carbon Cycle Learning Progression: A closer look at progress variables and processes 2009 NARST Written by: Lindsey Mohan, Jing Chen, Jinnie Choi , Yong-Sang Lee, Hamin Baek , & Charles W. Anderson (Michigan State University)

E N D
Validation of a Multi-Year Carbon Cycle Learning Progression: A closer look at progress variables and processes 2009 NARST Written by: Lindsey Mohan, Jing Chen, JinnieChoi, Yong-Sang Lee, HaminBaek, & Charles W. Anderson (Michigan State University) Culturally relevant ecology, learning progressions and environmental literacy Long Term Ecological Research Math Science Partnership April 2009 Disclaimer: This research is supported by a grant from the National Science Foundation: Targeted Partnership: Culturally relevant ecology, learning progressions and environmental literacy (NSF-0832173). Any opinions, findings, and conclusions or recommendations expressed in this material are those of the author(s) and do not necessarily reflect the views of the National Science Foundation.
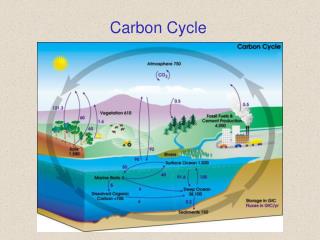
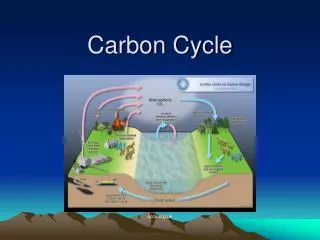
Validation of a Multi-Year Carbon Cycle Learning Progression A closer look at progress variables and processes Lindsey Mohan, Jing Chen, JinnieChoi, Yong-Sang Lee, HaminBaek, & Charles W. Anderson Process Dimensions Framework and Research Questions • Processes: • Plant growth/photosynthesis • Animal digestion and growth • Weight loss & movement/cell respiration • Decay/Decomposition • Burning/Combustion • Cross Process Goal: share results from statistical and conceptual analyses aimed at understanding and improving the assessment instruments used in our learning progression work. R1:Are there patterns in the way students account for matter and energy? Do they tend to score the same, higher, or lower on one or the other dimension? R2: How consistent are students in terms of their accounts of processes? Are there patterns that indicate students understand some processes more or less than others? • Results: • In general, most processes correlated with one another indicating that students tended to score the same despite the process • Photosynthesis correlated higher with other processes, while cellular respiration had moderate correlations with other processes. Sample: 771 assessments (190 elementary, 288 middle, 294 high) 25 assessment items; 45 item scores Wright Map Trends Progress Variable Dimensions • Progress Variables: • Tracing matter: conservation of matter (atoms and mass). • Tracing energy: conservation of energy and energy degradation • Results: • High correlation between matter and energy progress variables indicating that a student scoring a particular level on one progress variable is likely to score similarly on the other. • Items R1, D1, B1, and D2 showed differences in difficulty for matter and energy depending on the level. Item Threshold Difficulties Latent Distribution of Persons • Results: • In general it was fairly easy for our sample of students to score level 2 • It was difficult to score level 3 and 4 for many of the items. Conclusions: Dimensions (progress variables and processes) need to be monitored as the assessments and framework are revised.