Download

1 / 29
290 likes | 413 Views
Climate Change Impact on Eastern Tribes. Steve Crawford Environmental Director Passamaquoddy Tribe, Perry, Maine. Chair, Natural Resource Committee, USET Chair, TAMS Steering Committee National Tribal Water Council Member National Tribal Council Member. USET MEMBER TRIBES. USET Tribes.

E N D
Climate Change Impact on Eastern Tribes Steve Crawford Environmental Director Passamaquoddy Tribe, Perry, Maine Chair, Natural Resource Committee, USET Chair, TAMS Steering Committee National Tribal Water Council Member National Tribal Council Member
USET Tribes • 25 Tribes, from Maine to SE Texas • 538,000 acres (841 sq. mi, a bit less than RI) • <0.2% of eastern area (603,500 sq mi) • 51,000 tribal members • 0.04% of eastern population (121 million) Canary in the gold mine
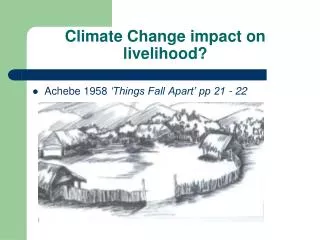
Tribal Vulnerability • Economically Challenged • Immobile • Poor Health • Spiritually/Culturally Invested in Specific Areas • High dependence on subsistence gathering
Basic Observations 2 • Mitigation not a Choice: • Adaptation only viable option: • Limited actions available: • Determine the changes • Identify the impacts • Determine adaptations that must be made • Develop strategic plan
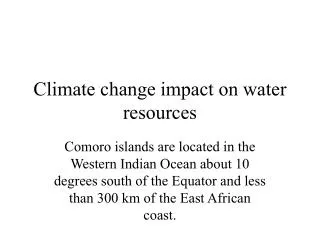
Water Resource Impacts • Warming • Increased Storm Intensity • NPS impacts • Erosion • Change in Location of ppt Events • Sea Level Rise
Atmospheric Impacts • Increased frequency/intensity of storm events • Heat wave impacts • Increased level of pollutants • HAPs • Ozone • SOx/NOx • Wind pattern changes
Impacts on Mercury • Fish Consumption Advisories • No Freshwater fish except Trout • “Reservoir Effect” • Enhanced Dry Periods Followed by Flooding • Everglades as Well as Northeast
Maine Tribes • Passamaquoddy Tribe Pleasant Point • 140,000 acres, 2,100 pop. • Passamaquoddy Township • 1,400 pop. Shares trust land with PP • Penobscot Tribe • 67,000 acres, 2,200 pop. • Aroostock Band of Micmacs • 1,300 acres, 1.800 pop. • Houlton Band of Maliseets • 860 acres, 830 pop
Maine Tribes • Moose: ticks, range change due to spruce/fir • Deer: loss of deer yards • Forestry impacts • Sugar maple • Forest pests/insects • <Ice skating • Wood is harder to split
Climate Change impacts on Forests Spruce/fir Hardwoods
Maine Tribes • Water • Salmon; lethal/chronic- behavior vulnerability • DO decrease • Algae blooms • Increased storms – nps pollution, turbidity • Lower pH – fresh and salt water
Southern New England Tribes • Wampanoag Tribe at Gay Head • 285 acres, 1,000 pop. • Mashpee Wampanoag Tribe • Narragansett Tribe • 1,950 acres, 2,620 pop. • Mashantucket Pequot Tribe • 1,400 acres, 315 pop. • Mohegan Tribe • 406 acres, 1,640 pop.
Southern New England Tribes • Increased fish and shellfish diseases • Increased mosquitoes and ticks • Decreased ice fishing • Increased forest diseases • Decreased water quality • Decreased sustenance gathering
Southern New England Tribes • Wampanoag’s of Gay head (Martha’s Vinyard • Tularemia • Spotted tick disease • Rising sea water • Changing sea water chemistry and lobster impacts • Mashpee Wampanoag’s • Ocean commercial fishing impacts
New York Tribes • St. Regis Band of Mohawks • 14,760 acres, 2,700 pop. • Oneida Indian Nation • 17,000 acres, 1,000 pop • Seneca Band of Indians • Approx. 20,000 acres, 7,300 pop. • ( a number of NY tribes have no land base)
New York Tribes • Chronic wasting disease in deer • Brown ash impact • Sugar maples impact • Water quality deterioration • Emerald borer impact on forests • Increased storm events • Positive impact on wind farm development?
Cherokee-North Carolina • 56,750 acres, 8,100 pop. • Positives: • Increased forest productivity • Alteration in medicinal food gathering • More tourists seeking cooler temps
Cherokee- North Carolina • Negatives: • Increased flooding/erosion • Increased fire hazards • Potential loss of spruce/fir and Carolina flying squirrel • Freshwater Trout hatchery Impacts • Increased cost, mortality, and perhaps not feasible • Elimination of Appalachian Brook Trout • Major economic implications to Tribe
Florida • Miccosuki Tribe • 79,712 acres, 550 pop. • Seminole Tribe • 89,000 acres, 2,760 pop.
Florida • Everglades impacts • Rising sea water levels • Increased mercury • Decreased water quality/quantity • Fires • Invasive species • Increased storm events
Gulf Coast Tribes: • Poarch Creek, Alabama • 230 acres, 2,230 pop. • Mississippi Band of Choctaw • 37,000 acres, 8,825 pop. • Tunica-Biloxi • 1,462 acres, 920 pop.
Chitmacha • 445 acres, 1,070 pop. • , Coushatta Band, Louisiana • 3,581 acres, 835 pop. • Alabama-Coushatta, Texas • 4,600 acres, 1,001 pop.
Gulf Coast Tribes • Increased storm events • Drought/fires • Long-leafed pine distress • Acid rain • Nitrogen deposition
Agencies With Tribal Climate Change Programs • EPA -Dinѐ College • DOI -Haskell U. • USGS -ITEP • NASA -NTAA • NCAR -BLM • AIHEC -NTSC • IIIRM -DOE
Actions (1) • Framework for Coordinated response • One=stop Website at ITEP • Mentoring • Internships • Forums • Workshops • Budburst.org/ National Phrenology Network
Actions (2) • Conferences: • National Tribal Forum , June 3-5, 2008, Las Vegas • National Tribal Conference of Environmental Management, June 23-27, Billings, MT
Actions (3) • Congressional • Lieberman-Warner. 0.5% Set-Aside, =$ 577 mil/yr 2012, for Disruption/Dislocation • Secure Water Act • Safe Drinking Water