Download
1 / 1
10 likes | 100 Views
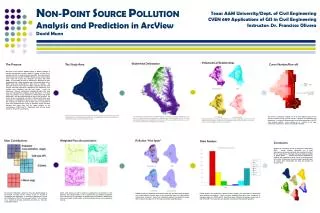
Learn about pollutant accumulation in Brazos County through GIS analysis using ArcView; determine factors affecting NPSP and predict pollutant concentrations. Study soil types, land use, precipitation grids, and more to identify pollution "hot spots." Understand watershed delineation, curve numbers, and runoff for better NPSP modeling and management.

E N D
Texas A&M University/Dept. of Civil EngineeringCVEN 689 Applications of GIS in Civil EngineeringInstructor: Dr. Francisco Olivera Pollutant/LU Relationships Watershed Delineation The Purpose Curve Number/Run-off Non-point source pollution (NPSP) presents a difficult challenge to engineers who attempt to model or predict it's impact. ArcView 3.0 is a valuable tool that can make such analysis possible. This project seeks to determine the accumulation of NPSP in Brazos County, locate problem areas within the County and distinguish the factors that effect NPSP. To accomplish this land use classifications, STATSGO soil data, precipitation grids, digital elevation maps and existing data from a NPSP study were incorporated as data layers in ArcView. The pollutants selected for this study were BOD, suspended solids (SS), total nitrogen, and total phosphorous. Watersheds were delineated, curve numbers were calculated, and the total surface runoff was determined. Pollutant contributions distributed throughout the study area were calculated by combining several data layers. The down stream accumulation of each pollutant was determined using ArcInfo Workstation. The data obtained from this process was analyzed. The results, which were displayed in ArcView, indicated which areas were responsible for contributing the largest amounts of pollutants. Analysis was conducted to determine what soil types were most prevalent in areas that contributed large masses of pollutants. Zonal summaries indicated that urban areas had the largest influence on the concentrations of BOD and SS. Agricultural areas had the largest impact on TN and TP concentrations. The amount of pollutants "washed out" of an area depends largely on the amount of surface run-off. Surface run-off is a function of precipitation and abstractions. A method for determing the run-off after abstractions is the SCS curve number method. Curve numbers are a function of soil type, composition, and land use. These are computed in ArcView. Data Analysis Further analysis was conducted to determine what variables were responsible for determining large pollutant accumulations. Zonal summaries established that urban areas contributed on average a larger mass of BOD and SS. Agricultural areas contributed on average a larger mass of both TN and TP. The results that were obtained concurred with the expected hypothesis. NON-POINT SOURCE POLLUTIONAnalysis and Prediction in ArcViewDavid Munn The Study Area Mass Contributions Weighted Flow Accumulation Pollution “Hot Spots” Conclusions ArcView was successfully used as an interface for determining NPSP. Several variables, distributed over a large heterogeneous area were considered and evaluated. A study of this sort would not be achievable without an interface capable of spatial analysis. ArcView had sufficient capabilities for handling and managing the large amount of data pertaining to the study. Furthermore, Arcview provided a good data base for analysis after manipulating the data and creating all necessary grids. The amount of pollutants "washed out" of an area depends largely on the amount of surface run-off. Surface run-off is a function of precipitation and abstractions. A method for determing the run-off after abstractions is the SCS curve number method. Curve numbers are a function of soil type, composition, and land use. These are computed in ArcView. ArcInfo work station was used to produce a weighted flow accumulation of each pollutant. This procedure allows a user to determine the accumulation of pollutants as run-off flows out of a watershed. A weighted flow accumulation is different from a flow accumulation in that weights, in this case pollutant masses, can be assigned to each cell. Additional grids were created to determine the areas that contributed large the largest mass of each pollutant. Statistics were used to calculate the upper 10% of the pollutant concentrations (mass/cell). Areas that contributed pollutant concentrations greater than or equal to the upper 10% of the range were located using Map Query.


![P oint-to- P oint T unneling P rotocol [PPTP]](https://cdn2.slideserve.com/4643726/p-oint-to-p-oint-t-unneling-p-rotocol-pptp-dt.jpg)