Download
1 / 35
350 likes | 520 Views
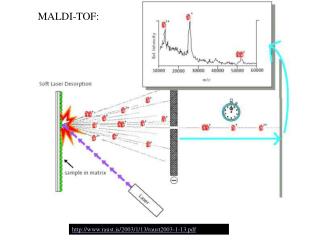
Accurate determination of protein profiles in complex biological samples by MALDI-TOF MS. Marvin L. Vestal SimulTOF Systems Lunchtime Workshop MSACL Tuesday, March 4, 2014. Commercial products introduced at ASMS 2012. V. SimulTOF Systems. Velocity and space focus. V g. 100 Linear.

E N D
Accurate determination of protein profiles in complex biological samples by MALDI-TOF MS Marvin L. Vestal SimulTOF Systems Lunchtime Workshop MSACL Tuesday, March 4, 2014
V SimulTOF Systems Velocity and space focus Vg 100 Linear detector V Vg detector 200 Combo Ion mirror detector V Vg Collision cell Ion accelerator timed ion selector 300 Tandem Ion mirror detector
1 shot ~24,000 ions detected 10% over all efficiency 10 shots Mixture of peptide standards, 100 femtomole/mL, 2.5 mm spot Laser spot ca. 50 mm, fluence 1.3x threshold, 0.4 attomole/spot=240,000 molecules
Sensitivity, Dynamic Range, and Reproducibility are Key Metrics Serum sample Diluted 1:10 in sinipinic acid Data from SimulTOF 100 Linear
Sensitivity, Dynamic Range, and Reproducibility are Key Metrics Serum sample Diluted 1:10 in sinipinic acid Superposition of spectra from 5 different spots Data from SimulTOF 100 Linear
Expanded view These are raw data. No normalization, background subtraction, smoothing or other data processing has been employed.
Expanded view x20 Expanded view of high mass region serum albumin x20
Conventional Wisdom • MALDI • is Not • Quantitive
4 spectra 50 shots ea. On one sample spot Intensity varies by factor of 20 @10 Hz requires 20 s Your Old MALDI
How do we make MALDI Quantitative???? Data Acquisition, One Example Data is acquired over mass range 1000-20,000 Da using 2 ns bins 2 kHz laser rate 50 shots averaged per spectrum 1 mm/s snake raster for 5 passes at 500 mm over 3 mm dia spot Total travel 12 mm in 12 s generating 480 spectra with 50 mm resolution Spectra with no significant peaks are not saved Only 10% of sample used, 240,000 total laser shots possible Data Processing (SimulTOF Wizard) • Peak table includes: • Intensity (number of ions/peak) • Mass • standard deviation • (square root of number of ions/peak) • Resolving power =m/dm=mass/FWHM Spot Average Baseline Correction Smooth Calibrate and Detect Peaks Normalize Bin by mass rather than time Quantify Report
Mass Binning • Data is binned into mass bins using the following form: • mn+1=mn(1+r), mn=m0(1+r)n, mN=m0(1+r)N, • m0 is the first mass, mN is the last mass, and N is the total number of bins. • Log(mN/m0)=N[log(1+r)], r=10[x/N]-1, where x=log(mN/m0), • for example, if mN/m0)=20, R=1/r=m/Dm=400 • Then N=1200 • One approach is to detect peaks in the unknown spectrum • Assign peaks to bins and sum intensity of all peaks in the bin. • An alternative approach is to sum intensity in each mass bin • and use this intensity as that for each bin. • The challenge is to determine which approach is best at minimizing • instrumental artifacts due to such problems as incomplete separation • of adjacent peaks. • We have evaluated performance with R=400 and R=2000
Comparing Spectra Use standard vector algebra on normalized and binned spectra Difference in spectra computed by (Na -Nb )/Square Root (Na +Nb ) For each bin
347 spectra 50 shots ea. 12s @2000 Hz
3 mm 0.5 mm 17,400 shots recorded out of 24,000 shots applied 10% of sample scanned in 12 s Spot 176
4 spectra 50 shots ea. On one sample spot Intensity varies by factor of 20 @10 Hz requires 20 s Your Old MALDI
Processed spectrum from same sample spot as above Our New MALDI
Spectra from 4 different sample spots super imposed Our New MALDI
Saliva Sample Prep Individuals spit into tubes, ~ 11 AM. Participants DK, DP, KP, MV. Spin 5 min. Dilute 10 ul of supernatant into 90 ul of 5 mg/ml HCCA matrix in 75% acetonitrile / 0.1% TFA Spot 2ul per well. First set of Sample tubes saved in refrigerator at 4 C for 6 days. Not stirred Fresh samples collected ~ 11AM. Spin again, repeat as above. 2 ul sample to 20 ul of matrix for rerun Samples for DK, DP, KP, MV. 6 each.
dp mv kp dp dk
DN Normalized to TIC, 400 RP mv-dp DN/s dp-dp
Normalized to TIC, 400 RP kp-dp DN/s dk-dp
Normalized to TIC, 400 RP DN/s kp-dp
dp-dp Normalized to Base Peak, 400 RP DN dp-dp DN/s mv-dp
Normalized to Base Peak, 2000 RP DN kp-dp DN/s mv-dp dk-dp dp-dp
mv dk mv
mv No change Fresh samples After 6 days at 4C
Fresh samples After 6 days at 4C dp No change mv
dp Fresh samples mv After 6 days at 4C
dp Fresh samples After 6 days at 4C
The Future of Diagnostic MS • MALDI-TOF • Very fast (full spectrum/laser shot @5 kHz) • Tradeoff between speed and sensitivity • Can be interfaced with variety of separations • Fully automated, no operator required Modular BenchTop Systems • SimulTOF Model 100 Linear MALDI • -sensitivity, dynamic range, speed, and simplicity • -wide mass range for proteins, peptides, and small molecules • SimulTOF Model 200 Combo MALDI • -adds high resolution reflector • -accurate mass of peptides and small molecules; • SimulTOF Model 300 MALDI MS-MS • -multiplexed TOF-TOF • -high resolution precursor selection • -identification and quantitation of peptides and small molecules. Highest Performance at Lowest Cost
Pathogen Identification Cancer typing directly from serum, • Tissue imaging of • Small molecules • for drug disposition • Biomarker Validation • Protein array reader • Tissue imaging of Proteins for cancer typing Clinical assays of Biomarkers
Conclusions • Resolving power 500-1000 over wide range is routine • Normalization to TIC or base peak removes most of amplitude variation • Each spot will yield up to 200,000 shots without degrading resolving power or accuracy and giving dynamic range limited only by chemical noise • Results might be improved by multiple levels of dilution and use of alternative matrices • Mass error <30 ppm across the plate over the full mass range with single peak automatic calibration • Dynamic range up to100,000