Download
1 / 31
310 likes | 336 Views
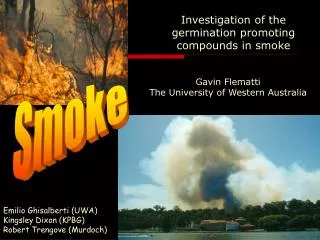
This study analyzes the impact of smoke on PM2.5 and OC mass, investigates major source regions using trajectory analysis, compares PMF results, and conducts case studies on smoke sources in the Sacramento region.

E N D
WRAP Smoke Analysis Sacramento, CA May 23, 2006 Jin Xu, Dave Du Bois, Mark Green, Ilias Kavouras
Average Contributions of Major Source Factors to PM2.5 Mass for Each Group
Average Contributions of Major Source Factors to PM2.5 Mass for Each Group
Smoke Analysis • General Analysis: • Summarize the contributions of PMF smoke factor to PM2.5 and OC mass. • Trajectory analysis to locate the major source regions of the “smoke” factor (PMF factor score weighted) • Compare PMF results between sites with known big contributions from smoke and the others without. • Investigate the relationship of OC / EC and the loading of the “smoke” factor. • Case Study (for selected sites): • The prescreening for identification of cases where smoke is the predominant source of fine particles at the receptor site and/or in other sites located in the region • Episodal analysis of air mass backward trajectories for the receptor sites. • Compilation of detailed records of biomass burning events. • Integration of the aforementioned data types into a GIS tool.
Smoke Source Profiles Averaged based on profiles generated for the 18 groups in WRAP. Error bar represents one standard deviation
Average Contribution of PMF Smoke Factor to PM2.5 Mass during 2000 - 2004
Average Contribution of PMF Smoke Factor to PM2.5 in 2002 WRAP CMAQ Modeling Results (only modeled natural fire emissions) PMF Results Missing hot spot due to missing IMPROVE data because teflon filters were clogged during the peak of the Rodeo-Chediski Fire (burned 462,614 acres, the largest most severe fire in Arizona history)
PEFO1 PMF Smoke Factor Contributions to PM2.5 and Light Extinction Missing Data
PMF source factor contributions to PM2.5 at PEFO1 in 2002 Data missing on 6/22 and 6/25 Assume all (and only) OMC is from smoke on 6/22 and 6/25
Fire Detections in 2002 • Web Fire Mapper displays active fires detected by the MODIS Rapid Response System, a collaboration between the NASA Goddard Space Flight Centre (GSFC) and the University of Maryland (UMD).
Comparison of PMF Modeled and Measured Total OMC in 2002 for the IMPROVE Sites in WRAP Each data point represents an average concentration in 2002 for one IMRPOVE site
Comparison of CMAQ Modeled and Measured Total OMC in 2002 for the IMPROVE Sites in WRAP
Contribution of PMF Smoke and All Other Factors to OMC (ug/m3) in 2002
Smoke Case Study (Sawtooth, Badlands and San Gorgonio ) Hypothesis to-be-tested Are “smoke” concentrations associated with fire events in the vicinity and/or upwind of the site? Methodology Air mass backward trajectories (at 500 m) and WRAP 2002 Fire Emissions Inventory; approximately 52 cases for Sawtooth, Badlands and San Gorgonio were analyzed (high, average and low “smoke” days) Product Maps of air mass trajectory and active fires during that day Limitations Spatial variation of fire emissions and air mass trajectory, no precipitation, noplume information THUS between-cases comparison cannot be done and; no quantitative information can be obtained
Legends Wildland fires Ag/NFRangeland 0-20(0-1)tons 20-500(1-5)tons 500-2000(5-20)tons 2000-4000tons 4000-16000 tons 16000-60000tons Filename: YYYYMMDD_SITE_day# SITE= SAWT, BADL, SAGO #=0 Sampling Day #=1 Sampling Day-1 #=2 Sampling Day-2 e.g. 20020809_SAGO_day0 * Fire data from 2002 WRAP Fire Emissions Inventory • Trajectory • Wildland Fire (Wildfires, Prescribed Fires, • Wildland Fire Use)* • Agricultural Burning no-CA* • Agricultural Burning CA* • Non-Federal Prescribed Rangeland Burning* • MODIS Fires
Time Series of Factor Contributions to PM2.5 (ug/m3) at SAWT1 in 2002
Average Contributions of Source Factors to PM2.5 Mass Concentration in Sawtooth National Forest in 2002
Factor Contributions to OMC at SAWT1 in 2002 Biogenic Emissions (SOA), Aged Smoke Plume or Inefficient Burning (Vegetation Fires) ? Gail Tonnesen and Tom Moore,Modeling Sensitivity Runs for Fire Emissions,White Paper for WRAP, December, 2004: “OC/EC ratio values on order of 3-5 (OMC/LAC ~ 4.2-7) suggest fossil fuel combustion contributions, while values greater than 7 (OMC/LAC>9.8) suggest fire emissions. High OC/EC ratios suggest a source mix resulting from either inefficient combustion (vegetation fires) or secondary organic formation.” 7/22 ?
Aged Wildland Fire Smoke Plume Sawtooth July 22, 2002 Smoke= 10.0 μg/m3 79.4% of PM2.5
8 Wildfire Agricultural fires 8 Sampling day-2 8Sampling day-1 8 Sampling Day 07/25/2002: Local Wildland firesSmoke=9.7 μg/m3 (89.16% of PM2.5)Unexplained OMC ~0.3 μg/m3 07/22/2002: Aged Wildland Fire Smoke Plume Smoke=10.0 μg/m3 (79.38% of PM2.5) Unexplained OMC ~ 3 μg/m3
Average Contributions of Source Factors to PM2.5 Mass Concentration in Badlands National Park in 2002
Aged Rangeland and Agricultural Fire Smoke Badlands May 29, 2002, very high OMC/LAC and unexplained OMC Smoke= 1.5 μg/m3 40.5% of PM2.5
Aged Smoke Plume Badlands Jun. 22, 2002 Smoke= 5.2 μg/m3 49.0% of PM2.5
Average Contributions of Source Factors to PM2.5 Mass Concentration in San Gorgonio Wilderness in 2002
Agricultural (and Wildland) Fires San Gorgonio Aug. 9, 2002 Smoke= 5.3 μg/m3 37.5% of PM2.5
Sawtooth, ID Bold= high smoke days Red = 20% worst days
Badlands, SD Bold= high smoke days Red = 20% worst days
San Giorgonio, CA PMF resolved a mixed smoke/urban factor Bold= high smoke days Red = 20% worst days
Case Study Conclusions For most of the examined cases, air masses intercepted fire events; only cases with very low PM2.5 mass (<1 μg/m3) were not associated with fire events Based on the analysis, the contributions of the following types of fires were determined: (a) wildland fires near the site (“hot” emissions); (b) wildland fires upwind of the site (aged smoke); (c) agricultural burning; (d) non-federal rangeland fires Given the limitations of this analysis, in 2002: Sawtooth: Spring/fall smoke events are due to rangeland fires; wildfires and local agricultural fires contribute to smoke during summer Badland: Spring/fall smoke events are due to rangeland fires; wildfires contribute to smoke during summer San Gorgonio: Smoke is usually mixed with urban emissions (air masses normally remain over LA for at least 12 h); Summer smoke events are usually associated with agricultural fires and upwind transport from large wildfires
Summary • PMF modeling results (close to CMAQ modeling results?) suggest that smoke contributed on average ~1.5 ug/m3 to PM2.5 in the Class I areas of the Western U.S. in 2002, much higher than the value of 0.46 ug/m3 assumed throughout the West in the EPA natural guidance document. • It is hard (if not impossible) for PMF to separate the primary and secondary OC into different factors using the IMPROVE data. • Generally, higher OC/EC ratios were observed during the fire events. A relatively significant amount of OC was not apportioned by PMF modeling for some sites. The no apportioned OC usually peaks when OC/EC ratio was high. • Secondary OC from biogenic emissions can result in high OC/EC ratio. • Aged smoke plumes usually contain a significant amount of OC generated from oxidation of biogenic VOCs from fires. OC/EC ratio is expected to be higher when OC is mostly from long-range transport smoke plumes than from local fires. • The ratio also depends on the burning type (e.g. forest fire < agricultural burning) and burning conditions. • It is possible to qualitatively (maybe even semi-quantitatively) attribute fire emissions to different fire types when detailed fire emissions inventory data are available. • Although primary aerosols emitted from forest fires are dominant based on the emissions inventory, vegetation burning (agricultural and rangeland fires) is also important especially to the sites closeby. Secondary OC associated with forest fires may also be important, especially to the sites at the downwind direction of the big wildland fires.