Download
1 / 20
200 likes | 221 Views
Learn what inequalities are, how to write and graph them, and solve with adding, subtracting, multiplying, and dividing. Includes algebraic inequalities and real-world examples.

E N D
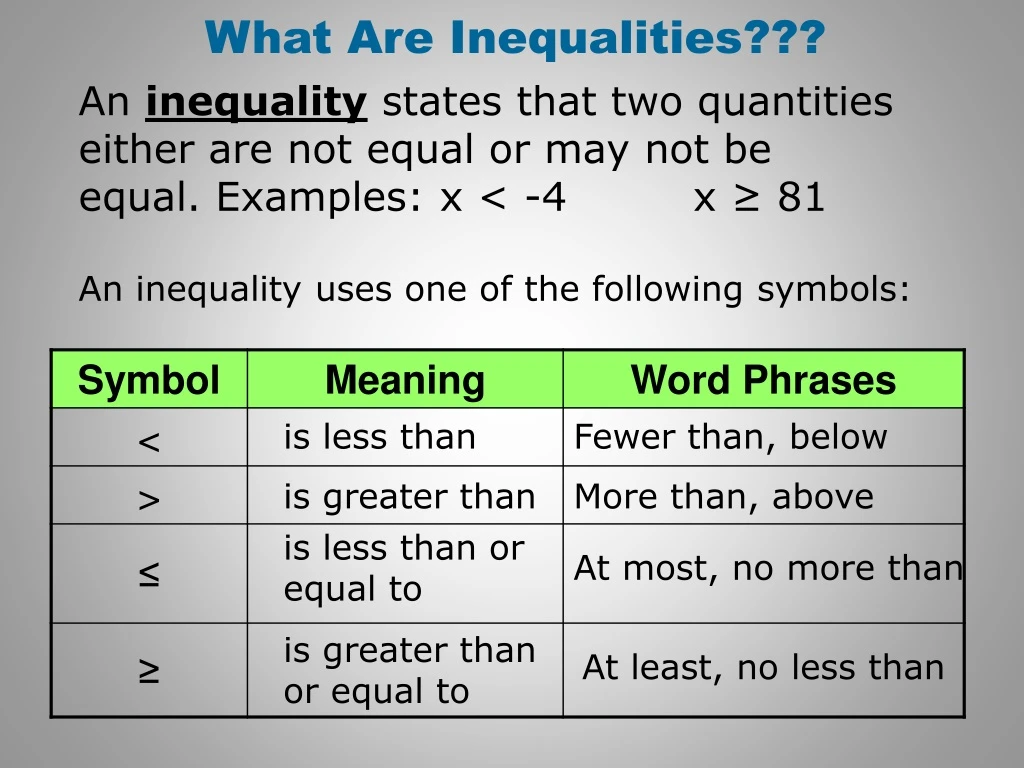
What Are Inequalities??? An inequalitystates that two quantities either are not equal or may not be equal. Examples: x < -4 x ≥ 81 An inequality uses one of the following symbols: is less than Fewer than, below is greater than More than, above is less than or equal to At most, no more than is greater than or equal to At least, no less than
Writing Inequalities Examples: Write an inequality for each situation. A. There are at least 15 people in the waiting room. “At least” means greater than or equal to. number of people ≥ 15 p ≥ 15 B. The tram attendant will allow no more than 60 people on the tram. “No more than” means less than or equal to. number of people ≤ 60 p ≤ 60
Writing Inequalities Examples: Write an inequality for each situation. C. There are at most 10 gallons of gas in the tank. “At most” means less than or equal to. gallons of gas ≤ 10 g ≤ 10 D. There is at least 25 yards of fabric left. “At least” means greater than or equal to. yards of fabric ≥ 25 f ≥ 25
An inequality that contains a variable is an algebraic inequality. A value of the variable that makes the inequality true is a solution of the inequality. An inequality may have more than one solution. Together, all of the solutions are called the solution set. You can graph the solutions of an inequality on a number line. If the variable is “greater than” or “less than” a number, then that number is indicated with an open circle.
Graphing Inequalities This open circle shows that 5 is not a solution. a > 5 If the variable is “greater than or equal to” or “less than or equal to” a number, that number is indicated with a closed circle. This closed circle shows that 3 is a solution. b ≤ 3
Graphing Inequalities Examples: Graph each inequality. A. n < 3 3 is not a solution, so draw an open circle at 3. Shade the line to the left of 3. –3 –2 –1 0 1 2 3 B. a ≥ –4 –4 is a solution, so draw a closed circle at –4. Shade the line to the right of –4. –6 –4 –2 0 2 4 6
Graphing Inequalities Examples: Graph each inequality. C. p ≤ 2 2 is a solution, so draw a closed circle at 2. Shade the line to the left of 2. –3 –2 –1 0 1 2 3 D. e > –2 –2 is not a solution, so draw an open circle at –2. Shade the line to the right of –2. –3 –2 –1 0 1 2 3
Solving Inequalities When you add or subtract the same number on both sides of an inequality, the resulting statement will still be true. –2 < 5 +7 +7 5 < 12 You can find solution sets of inequalities the same way you find solutions of equations, by isolating the variable.
–88 -66 -22 0 22 44 66 -44 Solving Inequalities by Adding & Subtracting Example A: Solve. Then graph the solution set on a number line. n – 7 < -29 n – 7 < -29 + 7 + 7 Add 7 to both sides. n< -22 Draw an open circle at -22 then shade the line to the left of -22.
–4 –2 0 2 4 6 8 10 Solving Inequalities by Adding & Subtracting Example B: Solve. Then graph the solution set on a number line. a + 10 ≥ 17 a + 10 ≥ 17 - 10 -10 Subtract 10 from both sides. a ≥ 7 Draw a closed circle at 7. Then shade the line to the right.
Solving Inequalities by Adding & Subtracting Example C: Edgar’s August profit of $137 was at least $20 higher than his July profit. What was July’s profit? Let p represent the profit increase from July to August. August profitwas at least$20 higher thanJuly’s profit. $137≥ 20 +p 137 ≥ 20 + p Subtract 20 from both sides. -20 -20 117≥ p p ≤ 117 Rewrite the inequality. July’s profit was at most $117.
Solving Inequalities by Adding & Subtracting Example D: Rylan’sMarch profit of $172 was at least $12 less than his February profit. What was February’s profit? Let p represent the profit decrease from February to march. March profitwas at least$12 less thanFebruary’s profit. $172≥p -12 172 ≥p - 12 Add 12 to both sides. +12 +12 184≥ p p ≤ 184 Rewrite the inequality. February’s profit was at most $184.
Solving Inequalities by Multiplying & Dividing When you multiply or divide both sides of an inequality by the same positive number, the statement will still be true. However, when you multiply or divide both sides by the same negativenumber, you need to reverse the direction of the inequality symbol for the statement to be true. Course 2
Solving Inequalities by Multiplying & Dividing Example E: Solve. c 4 ≤ –4 c 4 ≤ –4 c 4 (4) ≤ (–4) (4) Multiply both sides by 4. c ≤ –16 Describe how you would graph solutions on a number line.
Solving Inequalities by Multiplying & Dividing Example F: Solve. t > 0.3 –4 t –4 > 0.3 t (–4) Multiply both sides by –4 and reverse the inequality symbol. < (–4)0.3 –4 t < –1.2 Describe how you would graph solutions on a number line.
Solving Inequalities by Multiplying & Dividing Example G: Solve. 5a ≥ 23 5a ≥ 23 Divide both sides by 5. 5 5 23 5 3 5 , or 4 a ≥ Describe how you would graph solutions on a number line.
Solving Inequalities by Multiplying & Dividing Example H: Solve. 192< -24b Divide both sides by –24, and reverse the inequality symbol. 192 < -24b –24 –24 -8> b Describe how you would graph solutions on a number line.
Solving Inequalities by Multiplying & Dividing Example I: It cost Josh $85 to make candles for the craft fair. How many candles must he sell at $4.00 each to make a profit? Since profit is the amount earned minus the amount spent, Josh needs to earn more than $85. Let c represent the number of candles that must be sold. 4c > 85 Write an inequality. 4c > 85 Divide both sides by 4. 4 4 c > 21.25 Josh cannot sell 0.25 candle, so he needs to sell at least 22 candles, or more than 21 candles, to earn a profit.
Now You Try! Solve. 1.x – 4 > 17 2.p + 18 ≥ –6 x > 21 p ≥ –24 Write an inequality and solve. 3.There are at least 17 more bus riders than walkers in a class. If there are 7 walkers, how many bus riders are there? bus riders ≥ 24
Now You Try! Solve. 4. 5. 6.18w < 4 7.–4f > 36 8.It cost a candle company $51 to make a dozen candles. How many candles must it sell at $7 apiece to make a profit? s 9 > 12 s > 108 b –14 > 6 b < –84 2 9 w < f < –9 more than 7 candles, or at least 8 candles