Download
1 / 31
310 likes | 457 Views
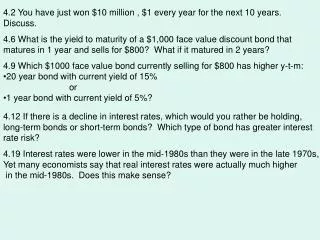
4.2 You have just won $10 million , $1 every year for the next 10 years. Discuss. 4.6 What is the yield to maturity of a $1,000 face value discount bond that matures in 1 year and sells for $800? What if it matured in 2 years?.

E N D
4.2 You have just won $10 million , $1 every year for the next 10 years. Discuss. 4.6 What is the yield to maturity of a $1,000 face value discount bond that matures in 1 year and sells for $800? What if it matured in 2 years? • 4.9 Which $1000 face value bond currently selling for $800 has higher y-t-m: • 20 year bond with current yield of 15% • or • 1 year bond with current yield of 5%? 4.12 If there is a decline in interest rates, which would you rather be holding, long-term bonds or short-term bonds? Which type of bond has greater interest rate risk? 4.19 Interest rates were lower in the mid-1980s than they were in the late 1970s, Yet many economists say that real interest rates were actually much higher in the mid-1980s. Does this make sense?
Interest Rate Determination: Demand and Supply of “Bonds”Demand for an Asset • Wealth • Expected return…relative to alternative assets • Risk—uncertainty of return—relative to alternative assets • Liquidity—ease and speed an asset can be turned into cash—relative to alternative assets
Interest Rate Determination: Bond Market Approach P down i up i = r + πe
Interest rates generally rise when economy expands P down i up
Interest Rate Determination: Demand and Supply of Money • Demand for money: • Buy stuff • Pay for stuff • Meet payments when they come due • Pick up “bonds” when their price falls • Md = L($Y,i) = L(P,Y,i) • Supply of money: Monetary Policy • Buy Ease Sell Tighten
Shifts in the Demand for Money • Income Effect: • Higher income more stuff bought demand for money at each interest rate increases • Price-Level Effect: • Rise in the price level need more money to buy the same amount of stuff the demand for money at each interest rate increases • Monetary Base: Controlled by Fed • Money Multiplier: (1 + c)/(c + r + e) • We’ll assume Ms controlled by Fed Shifts in the Supply of Money
Interest Rate and the Money Supply • Liquidity effect: Ms uplowers interest rates But Ms up also increases output and prices • Income effect: Ms up increased output increased demand for money interest rate up • Price-Level effect: Ms up increased price level increased demand for money interest rate up • Expected-Inflation effect: Ms growth up expectation of ongoing inflation (maybe) i up Since i= r + πe, if π and πecatches up as it must, i too Since (M/P)d = L(Y,i) is stable at each Y, (M/P)smust fall when π . P must rise faster than M.
Response over time to Increase in the Rate of Growth of the Money Supply
5.6 An important way in which the Fed decreases Msis by selling bonds to the public. Using a supply and demand analysis for bonds, show the effect on i. Using the liquidity preference framework, show the effect on i. 5.17. The Chairman of the Fed announces that interest rates will fall and stay low next year. What will happen to corporate bond interest rates today? Explain.
Interest Rate Differentials • Tax-free rates typically lower than taxable rates • People care about after-tax return • Tax-free bonds “tax expenditure” • Government rates typically lower thancorporate rates • Default risk • U.S. T-bonds are considered default free • Risk premium—the spread between the interest rates on bonds with default risk and the interest rates on T-bonds • Short-term rates typically lower than long-term rates • Interest rate risk • Liquidity—the ease with which an asset can be converted into cash
There are two great powers in the world, the US and Moody’s. The US can destroy you by dropping bombs. Moody’s can destroy you by dropping your credit rating.
Term Structure of Interest Rates Yield curve—a plot of the yield on bonds with differing terms to maturity but the same risk, liquidity and tax considerations • Observations • Interest rates on bonds of different maturities move together over time • When short-term interest rates are low, yield curves are more likely to have an upward slope; when short-term rates are high, yield curves are more likely to slope downward and be inverted • Yield curves almost always slope upward
Movements over Time of Interest Rates on U.S. Government Bonds with Different Maturities
Segmented Markets Theory • Bonds of different maturities are not substitutes at all • The interest rate for each bond with a different maturity is determined by the demand for and supply of that bond • Investors have preferences for bonds of one maturity over another • If investors have short desired holding periods and generally prefer bonds with shorter maturities that have less interest-rate risk, then this explains why yield curves usually slope upward (fact 3)
Expectations Theory of Term StructureBonds with same tax, risk and liquidity are substitutesExplain the yields of bonds of different durations
Expectations Theory • Explains why the term structure of interest rates changes at different times • Explains why interest rates on bonds with different maturities move together over time (fact 1) • Explains why yield curves tend to slope up when short-term rates are low and slope down when short-term rates are high (fact 2) • Cannot explain why yield curves usually slope upward (fact 3)
Liquidity Premium and Preferred Habitat Theory Bonds of different maturities are substitutes but not perfect • Interest rates on different maturity bonds move together • Yield curves tend to slope upward when short-term rates are low and to be inverted when short-term rates are high; • Yield curves typically slope upward -- a larger liquidity premium as the term to maturity lengthens
Reading the tea leaves: http://stockcharts.com/charts/YieldCurve.html
Some problems 6.3 Why are corporate bond yields countercyclical? 6.5 If yield curves on average were flat, what would this say about term premiums? Would this support expectations theory? 6.6 Plot the yield curve when current and expected one-year interest rates are (a) 5%,7%,7%,7%,7%; (b) 5%,4%,4%,4%,4% Now suppose these are current one-year, two-year, …, rates. What one-year rates are expected in future years? 6.9 Make sense of this yield curve