Download
1 / 24
240 likes | 427 Views
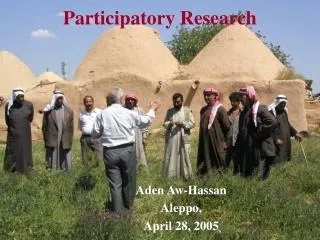
A platform for Participatory Sensing Systems Research. PEIR, the Personal Environmental Impact Report. Samori Ball EEL 6788 2/21/2011. What is a PEIR? Personal Environmental Impact Report What is an Environmental Impact Report?

E N D
A platform for Participatory Sensing Systems Research PEIR, the Personal Environmental Impact Report Samori Ball EEL 6788 2/21/2011
What is a PEIR? • Personal Environmental Impact Report • What is an Environmental Impact Report? • An Environmental Impact Report is conducted for a proposed project to determine how the project, if implemented, will affect the environment. • A PEIR is substantially different from an EIR. • In this case a PEIR is a 2 way report to determine what impact each person has on the environment as well as the impact the environment has on each person.
What is PEIR? • Who created PEIR? • The PEIR participatory sensing application is a collaborative project between several professors in the Center for Embedded Networked Sensing at the University of California, Los Angeles and researchers at the Nokia Research Center, Palo Alto. • It is supported by Nokia and the National Science Foundation (NSF)
What is PEIR? • Why was PEIR Created? • To bring specific environmental aspects of our personal lives to light so that its users can make more informed and responsible decisions • Realtime website and Facebook app. • Students compete to achieve the lowest environmental impact. • Help people to avoid environmental risks • Routes are generated showing exposure along the route. • Participants can share route information.(manually) • Demonstrate the broad applicability of the processing model used in PEIR to other geographically organized models. • Fast Food exposure metric • The metrics were selected because of their social relevance, and their ability to be customized for individual participants using time-location traces.
What is PEIR? • What does PEIR Measure? • Smog or particulate exposure(PM2.5) • A user’s transportation-related exposure to particulate matter emissions from other vehicles. • Carbon Impact(CO2) • Measure of transportation-related carbon footprint, a greenhouse gas implicated in climate change • Sensitive Site Impact • A user’s transportation-related airborne particulate matter emissions (PM2.5) near sites with populations sensitive to it, such as hospitals and schools • Fast Food exposure • The time integral of proximity to fast-food eating establishments
Where is PEIR used? • Created in 2008 • Up and running since June 2008 with 30 trial users • Currently in closed beta in several California cities between Los Angeles and San Francisco • Used by High School and College students as well as professors
Video about PEIR http://www.youtube.com/watch?v=YGZ41wH74_s&feature=player_embedded
How does it work? • Participants use one of 3 phone clients, • 2 for Symbian S60 3rd edition, and • 1 for Windows mobile, • Tested phones included Nokia N80, N95, and E71. • The phone gathers data from the users and sends it to a server every 30 seconds. • Time, • GPS • Accelerometer • The server processes the data to determine which activity the user is performing: • Standing, • Walking, • Driving.
How does it work? • The sever then uses the • Activity, • Location, and • Time data • This data is cross referenced with • MADIS weather information from NOAA • Traffic models and • Vehicle emission estimates from California Air Resources Board(CARB) data model for fine particulate matter(PM 2.5) • Carbon dioxide estimated from California Air Resources Board(CARB) data model to calculate exposure.
How does it work? • When a user is determined to be in the activity, driving, • The speed is calculated • The result is combined with estimated vehicle emissions to determine a users particulate matter and carbon pollution • This result is compared to locations of sensitive sites to determine if the user has come within 200 feet. • The server uses the location information to determine whether a user has come within 1/4 mile of a fast food restaurant. • The sever segments the data into trips. • Trips are defined as traveling from one place to another where the user stays for more than 10 minutes.
How does it work? • The server takes the data and trips and sends the data to: • The web • A facebook application • Once the data is on the web: • The route information can be viewed • Exposures along route are calculated and viewed • Aggregated data is viewable • Trends can be analyzed
How does it work? • Server-side processes are implemented using • Python code, • Shell scripts, and • Native/pre/compiled libraries • Reads from Post GIS and implemented in PHP and Flash • Served by Apache using Wordpress.
Technical Challenges • Activity Classification • Map Matching • Near Real Time Modeling of Exposure and Impact • Privacy
Technical Challenges • Activity Classification • To differentiate walking from being stuck in rush hour traffic freeway annotated GPS data is used • Map matching • Naïve matching • Finds the nearest road segment a correct match • Sensitive to spatial road network and often fails • Intersection-based • Compares the 2 nearest roads and intersections to GPS data point • Intersection w/nearest road and substitution • Uses the Intersection-based approach adding an algorithm for cases when there are not common roads between 2 consecutive intersections
Technical Challenges • Activity Classification • Difficult to differentiate between walking from driving slow on a residential street • Determining walking from standing inside buildings is problematic for some users
Technical Challenges • Near Real Time Modeling of Exposure and Impact • GPS records were sampled every 30 seconds • Reduces power and bandwidth • Lowest sample rate that still resulted in good automatic classification of high speed travel by car. • The Emissions Factors Model(EMFAC) was too slow. • An approximation to the EMFAC was developed via a functional ANOVA model
Technical Challenges • Privacy • PEIR defaults to sharing only aggregate impact and exposure data • Both user profiles and the Facebook application share and compare daily impact and exposure numbers without revealing any location data • Route Sharing not currently implemented, but security issues are discussed. • Route Hiding • Route hiding is considered for partial route sharing • Deleting parts of a route would look suspicious • Route hiding lets a part of a shared route be inconspicuously replaced
Technical Challenges • Privacy • Retention and Deletion • Retained data of a users data could be subject to theft or subpoena • Aggregate data is retained indefinitely • User location data is deleted after 6 months • Users can change retention length • Users can delete specific routes or locations in their trip diaries
Weaknesses • Modeled Data • EMFAC data is an approximation and this system actually uses an approximation of that • EMFAC data is not based on a specific vehicle, but a vehicle type • GPS map data is not completely accurate • Actual exposure window up/down, Dusttrack • Exposure estimate doesn’t compensate for window up/down for exposure • Ambient background PM2.5 exposure is not taken into consideration • Residential PM2.5 is underestimated • High Traffic Area PM2.5 is overestimated
Future planned improvements and extensions • Enable users to share location data with people they trust • Giving users the option to share designated routes with specific people to encourage discovery of new routes • Enhancements to improve scalability • Modular interfaces • Easier integration with local models and data sets relevant to PEIR inferences • Extend the activity classification to accommodate modalities common in other locations • Cycling • Bus • Train • Subway
Resources Used Personal Environmental Impact Report PM2.5 Exposure Level Validation and Outdoor UCB Particle Monitor Assessment for Personal Environmental Impact Report – research.cens.uda.edu Green at WIRED NextFest:GPS-Based Personal Environmental Impact Report(PEIR)- www.treehugger.com Part 04 Per Personal Environmental Impact Report(PEIR) Validation and Redesign – research.cens.uda.edu/urban/2010/part04.pdf Personalized estimates of environmental exposure and impact – urban.cens.uda.edu/projects/peir