Download
1 / 29
300 likes | 453 Views
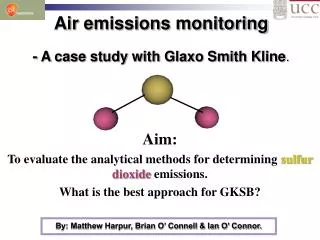
Air emissions monitoring - A case study with Glaxo Smith Kline. Aim: To evaluate the analytical methods for determining sulfur dioxide emissions. What is the best approach for GKSB?. By: Matthew Harpur, Brian O’ Connell & Ian O’ Connor. The Sulfur Cycle & the Environment.

E N D
Air emissions monitoring - A case study with Glaxo Smith Kline. Aim: To evaluate the analytical methods for determining sulfurdioxide emissions. What is the best approach for GKSB? By: Matthew Harpur, Brian O’ Connell & Ian O’ Connor.
The Sulfur Cycle & the Environment. • Ecosystems respond to climate systems through physical, biological & chemical feedback systems. • Anthropogenic emissions of SO2 alter the balance of the sulfur cycle in our biosphere. • This has adverse effects on human health and alters the balance of the Earth-atmosphere system; • Acid Air • Change in Earth’s energy budget. SO2 SO4`2- The Biogeochemical Cycles in our Biosphere
The Environmental Impact of Anthropogenic SO2 Emissions. • Anthropogenic sulfur emissions to the atmosphere are significant and can be larger in magnitude than those from natural sources in urban regions in the industrialised developed world. • Atmospheric sulfur compounds exists in aerosols –condensed phase particles in stable suspension with gases – e.g. hazes & smogs. Acidic aerosols contain sulfate particles. Such aerosols adversely impact on human health. • Sulfate particles are derived from SO2 gas in air scatter light and reduce amount of solar heat reaching the Earth’s surface – add to ‘Global Dimming’ phenomenon.
The Environmental Impact of Anthropogenic SO2 Emissions. • Monitoring of SO2 emissions is a fundamental aspect of an environmental authorities air control policy. • Primary inorganic pollutant gases play an important role in atmospheric acidity. Sulfur dioxide is a primary inorganic gas pollutant. It takes part in chemical reactions in the atmosphere and produces secondary pollutants such as sulfate compounds in particulate. • These secondary pollutants formed in the atmosphere include acidic sulfate aerosols.
GlaxoSmithKline (GSK) • GSK is the second largestpharmaceutical company in the World. • The company is a global leader and a pioneer in all elements of healthcare from R&D and vaccines to all the main therapeutic areas. • The Cork facility was established in Carrigaline in 1974 and employs over 400 people. • The facility generates solid waste from its production processes which it deals with on site.
Incineration at GSK • There are three high temperature toxic waste incinerators at the site. • The three units are designed to burn solids,liquids and vapours from chemical processes. • The units operate at a temperature of 1100 0C and there is 99.99% removal of the toxic waste. • By products of the incineration include SO2. • Each incinerator has a continuous emission monitoring system installed. A schematic of the operations of a typical incinerator showing gaseous pollutant formation.
Reasons For Continuous Monitoring • Continuous emissions monitoring equipment is installed for a number of reasons. • Regulatory compliance. • Monitoring of plant performance. • Calculation of emissions inventories. • Compilation of environmental impact assessments
Legislation • The primary environmental legislation driving continuous emission monitoring is the Integrated Pollution Prevention and Control (IPPC) which is embodied in the IPPC directive of 1996. • This requires all industrial operations covered by the directive to obtain a permit from authorities within the country. • The Permit is based on the concept of Best Available Techniques (BAT) which is sometimes costly for plants to adapt to BAT. • The directive allows installations an eleven-year transition period to achieve compliance beginning on the day that the directive entered into force.
The EPA’s role • GSK send the EPA quarterly reports of all continuous monitoring data. • An alternate to this is real time data gathering from industries by direct computer link up. • This is used in Germany however, the EPA feel that this would be expensive and technically challenging to install for industries in Ireland such as GSK. • The EPA has a team that carry out spot checks on flue gas monitoring, occasionally throughout the year to validate results. • To date GSK have been in full compliance with EPA regulations regarding SO2 emissions from the plant. • The EPA consider their role in the future is unlikely to change unless legislation is strengthened.
EPA Method of Analysis for SO2 • The EPA use a Horiba PG-250 Portable Multi-gas Analyzer when spot checks are carried out at GSK • The PG-250 is a portable stack gas analyzer that can simultaneously measure up to five separate gas components. • The PG-250 uses non-dispersive IR detection for CO, SO2, and CO2. • The performance of the PG-250 has been tested and verified under anumber of programs. PG-250 portable stack gas analyzer
Extractive monitoring system In situ monitoring system. Continuous Emission Monitoring Technologies • Continuous emission monitoring or automated measuring systems can be categorised into two types: • Type 1: Extractive systems • Type 2: In situ systems • Extractive systems withdraw flue gas continuously from stack and transport it to the analyser. • In situ systems carry out most of their operations in the stack. • Point in situ carry out analysis at a single point in the stack. • Path monitors carry out analysis usually over the entire stack.
Technique presently in use at GSK • GSK are presently using a Perkin – Elmer MCS 100 Multi component Non –dispersive infrared (NDIR) system for SO2 analysis. • This is an extractive system. • The principle of the method is based on Beer lamberts law. (A=ε x c x l). • Many heteroatomic ( e.g. SO2,CO2) gaseous molecules absorb light in the IR region. • In NDIR light is emitted from a heated coil through a reference cell and the sample cell. MCS 100 Multi component Non –dispersive infrared (NDIR) system for SO2 analysis.
Technique presently in use at GSK • As the beam passes through the sample cell the pollutant molecule absorbs some light. • The light energy entering the cell will now have less energy. • The energy difference is detected by a solid state detector. • The ratio of the detector signals from the cells gives the light transmittance. • This ratio can be related to the pollutant gas concentration. Typical IR spectrum Courtesy of cascade-technologies, UK.
Limitations of NDIR • A limitation of this method is that gases that absorb light in the same spectral region will cause a positive affect. • Water vapour and CO2strongly absorb in the IR region. • At GSK these molecules are removed by a scrubber, decreasing interferences. • Also, another solution to this problem by using absorption cells arranged in series. • This is incorporated into systems to enable accurate detection of emission gases. Scrubber A typical scrubber system
Luft Detector NDIR • The Luft detector works on the same basis as the simple NDIR. • The reference cell and a sample cell are arranged in series. • The light energy is absorbed by the SO2 causing the gas to heat up. • Differential heating caused by the difference in IR light causes a differential pressure between the two cells. • The pressure difference between the two cells is detected by a flow sensor. Luft Detector with cells in parallel.
Luft Detector NDIR • This dual beam analyser is a standard method for analysis of SO2 across Europe. • It has received regulatory approval in Germany. • However, these detectors are more susceptible problems associated with vibration than other detectors. • The development of microflow sensors has helped to overcome this problem. Luft detector unit.
Courtesy of Maine tech. UK. Fourier Transform Infrared (FTIR) Spectroscopy • FT-IR is the preferred method of infrared spectroscopy and is growing in popularity for the multi component analysis of stack gases. • It produces a infrared spectrum with a unique combination of bands corresponding to an individual species, creating a distinct fingerprint for the sample.
A Typical Interferogram. What is FTIR? • The heart of the system is the interferometer in which the light from the source is divided into two beams. • Beams pass through the sample cell and then recombine resulting in a signal. • All information required to identify and quantify the gases in the sample is present in the interferogram. • Interferogram signal is converted to a frequency spectrum by a mathematical technique called Fourier Transformation.
Advantages and Disadvantages of FTIR • Advantages • Analysers capable of measuring 50 determinants. • Fewer interferences than IR • Does not require frequent calibration. • Typically have a range of 2.5 to 25 µm. • Disadvantages • Difficulty in obtaining a representative background • Generation of large amounts of data from inferograms when continuous emission monitoring Real time FTIR analyzer: supplied by Applitek, Venecoweg, 199810 Nazareth, Belguim.
Monitoring of Air using Fluorescence • Fluorescence spectroscopy is a powerful tool for the study • of chemical & photochemical species. • Absorption of UV radiation is followed by fluorescence at • longer wavelengths. • Intensity of fluorescence is used to determine the • concentration of analyte. • Changes in concentration can be detected rapidly, changes in • fluorescence intensity within picoseconds can be detected. • Fluorescence signal is proportional to concentration and • therefore high sensitivity can be achieved.
SO2 Detection using Fluorescence. • Sulfur dioxide molecules absorb light at a specific wavelength (214 nm) & emit light at a longer wavelength. • Fluorescence occurs as the molecules emit excess energy and return to ground state. • The distribution of wavelength is dependent on intensity of emitted energy. This is shown in a fluorescence emission spectrum.
Monitoring of SO2 using Fluorescence UV – Fluorescence SO2 Analyzer (as used by Queensland Authority Austrailia). Air sample intake UV – Fluorescence detectors can be used in on-line monitoring systems. Fluorescence is detected using a photomultiplier tube. A hydrocarbon ‘scrubbing’ system removes interfering molecules prior to measurement.
Differential Optical Absorption Spectroscopy - DOAS Applicable to extractive & in situ systems Method principle is Beer-Lambert Law. Light of different length is transmitted across emission stack. Light wavelength are selected using – diode laser, photodiode arrays or moving slits. Detector’s signal at wavelength where no absorption occurs is reference measurement.
DOAS – How it works Courtesy of Enviro Tech. UK
Measurement cell & heated oven for the sample cell Heated sample line including temperature regulator Heated sample probe including filter unit Sample pump to extract gas via heated extraction line. Automatic calibration unit in order to meet the requirements from the local environmental authorities. DOAS - Extractive System features
Conclusions • Glaxo Smith Kline have been fully compliant with requirements with respect to SO2 emission to ambient air. • GSK use Non-dispersive Infrared technique for SO2 emission analysis. • EPA use Non-dispersive Infrared technique for SO2 emission analysis as part of air emission compliance programs. • Alternative techniques are available, which include analysis methods which are more sensitive and selective with respect to SO2 detection.
Conclusions • Fluorescence analysis includes techniques which use detection methods such as Pulsed Fluorescence Detectors (PFD) which are specific to SO2. • Differential Optical Absorption Spectroscopy (DOAS) is easily incorporated into stack systems that monitor for multiple gas emissions. • Under present legislation conditions including ‘Best available techniques’ (BAT) there is no requirement for change in SO2 analysis method at GSK.
Acknowledgements • Ian McAuliffe • Peter Webster • Keith Golding • Lynn Davies • Robert McDowney • Ruth Hopkins