Download

1 / 1
20 likes | 133 Views
Modeling of Longitudinal Tumor Size Data in Clinical Oncology Studies of Drugs in Combination N. Frances 1 , L. Claret 2 , F. Schaedeli Stark 3 , R. Bruno 2 , A. Iliadis 1 1 School of Pharmacy, University Méditerranée, Marseille, France;

E N D
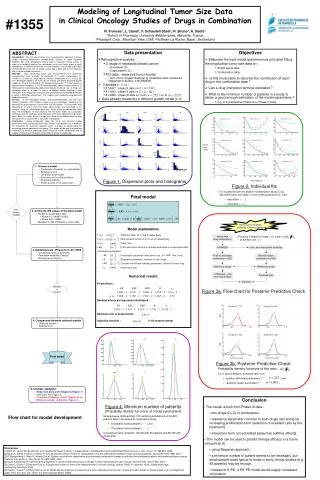
Modeling of Longitudinal Tumor Size Data in Clinical Oncology Studies of Drugs in Combination N. Frances1, L. Claret2, F. Schaedeli Stark3, R. Bruno2, A. Iliadis1 1School of Pharmacy, University Méditerranée, Marseille, France; 2Pharsight Corp., Mountain View, USA; 3Hoffman-La Roche, Basel, Switzerland #1355 « Posterior Predictive Check » on ( at the first visit ) Actual data (drug combination) Intra- and inter-patient variability NONMEM Posthoc estimated parameters n=222 Random drawn parameters n=1000 Reference design Reference design Data presentation • Retrospective analysis : • 2 drugs in metastatic breast cancer • Docetaxel (D) • Capecitabine (C) • PD-data : observed tumor burden • sum of the longest diameter of metastatic sites measured (dependent variable in NONMEM) • 3 studies [1, 2, 3] : • # 14697 : phase II data on C ( ) • # 15542 : phase II data on C ( ) • # 14999 : phase III data on C+D ( ) vs. D ( ) • Data already treated by a different growth model [4, 5] Objectives • Elaborate the best model (parsimonious principle) fitting the longitudinal tumor size data on : • Single agent data • Combination data • Is this model able to describe the contribution of each drug in the combination data ? • Can a drug interaction term be estimated ? • What is the minimum number of patients in a study to obtain a good enough estimation of the model parameters ? • e.g. in a prospective Phase Ib or Phase II study « Observed » ratio (from actual data) ABSTRACT Introduction : The analysis of tumor size measurements, obtained in clinical studies involving combination chemotherapy, remains an open modeling problem. We used retrospective clinical data in metastatic breast cancer in order to investigate whether the contribution to the anti-tumor effect of each compound in a combination setting can be estimated 1) from single agent data and combination data with or without single agent data, and 2) from datasets with a limited number of patients . Methods : Data concerning tumor size measurements and treatments characteristics were available for docetaxel (D, n=223), capecitabine (C, n=168) [1, 2] given as single agents and their combination (D+C, n=222) [3]. The developed model is an extension of already presented disturbed growth models [4, 5] and it is based on the following hypotheses: 1) Tumor growth is exponential or Gompertz; 2) K-PD model describes administration protocols; 3) Resistance is materialized by exponential decline of cell-kill rate; 4) Drugs are combined either in a linear, or Emax, or Weibull model involving a drug interaction term. Population analyses were performed using NONMEM Version 6 within a MATLAB environment. The models were validated using posterior predictive checks. Results : In the developed models, over-parameterization was the most frequent problem. K-PD models involve only one parameter expressing the dynamics of drug amounts in the cell-kill rate formulation. This parameter was obtained for D and C from the single agent studies and was fixed in the analysis using the combination data only. When using the combination data only, the contribution of each drug to the anti-tumor effect was accurately estimated and the estimates were consistent with those obtained using single-agent data. The effect of the 2 drugs was found to be additive with no drug interaction term. Situation #2 is still under investigation. Conclusion : Using combination data, the tumor size dynamic model parameters were successfully estimated. Further investigations are in progress for assessing the minimum required extent and type of clinical data for evaluating drug combinations in oncology. This model will be part of a modeling framework to simulate expected clinical response of new compounds and to support end-of-phase II decisions and design of phase III studies [6]. Predicted ratio pdf(ratio) KL KEC KED R n0 0.008 0.008 0.008 0.008 100 KL 40 50 60 Patient ID n° 30 Patient ID n° 74 Patient ID n° 85 0.002 0.002 0.002 0.002 80 0 50 35 60 40 50 0.0012 0.0012 0.0012 0.0012 30 40 30 KEC 20 20 25 0.0004 0.0004 0.0004 0.0004 0 0 10 20 30 0 10 20 30 40 0 5 10 15 80 2 2 2 2 30 Patient ID n° 91 120 Patient ID n° 88 Patient ID n° 87 100 KED 70 25 100 0.5 0.5 0.5 0.5 Tumor 20 60 0 size 15 80 50 (mm) 10 0.12 0.12 0.12 0.12 40 60 5 100 R 50 0 5 10 15 20 25 0 10 20 30 40 50 0 10 20 30 40 50 0.04 0.04 0.04 0.04 0 80 120 Patient ID n° 122 Patient ID n° 147 Patient ID n° 153 50 100 • Choose a model • Proliferation Gompertz vs. exponential • Resistance term • Dynamical dose model • Estimation of the initial condition • Residual variability • Define bounds in the parameters 60 300 300 300 300 100 40 50 n0 100 100 100 100 40 30 80 0 0.002 0.008 0.0004 0.0012 0.5 2 0.04 0.12 100 200 300 20 20 60 10 0 5 10 0 10 20 30 40 0 10 20 30 40 Figure 1. Dispersion plots and histograms Time (weeks) Figure 2. Individual fits • For 9 patients from the phase III combination study (C+D), observed tumor size data (o) and model predictions vs. time : • population ( - - -), • individual ( ) Final model Non usable models • Define the KB values in the dose model • Studies on single agent data • Phase II-C (14697+15542) • Phase III-D (14999) • Validation on the combination (C+D) data Remove the variability added by individual designs • Model explanations • : “Effective dose” for C and D respectively • : Administration protocols for C and D respectively • : Tumor size • : K-PD elimination constants (already evaluated on single agent data) • Estimated parameters : • : Proliferation parameter (max tumor size : mm, fixed) • : Resistance parameter, common to both drugs • : Constant cell kill rate (efficacy parameter), distinct for each drug • : Initial tumor size • Modeling tests : Phase III-(C+D) 14999 • Covariance matrix of estimates • Parameter variability (Omega) • Residual error (Sigma) Numerical results Validated models Fixed effects : Random effects are log-normal distributed : Residual error is proportional : Objective function : (>100 models tested) Figure 3a. Flow chart for Posterior Predictive Check 5 5 Design ID n° 172 Design ID n° 487 4 4 3 3 pdf 2 2 • Comparison between retained models • Objective function • Residual error 1 1 0 0 0 0.5 1 1.5 0 0.5 1 1.5 5 5 Design ID n° 425 Design ID n° 333 4 4 KL KEC n0 300 800 0.08 3 3 700 pdf 250 2 2 600 0.07 200 500 1 1 Final model 150 400 0 0 0.06 0 0.5 1 1.5 0 0.5 1 1.5 300 100 Tumor size ratio Tumor size ratio 200 50 Figure 3b. Posterior Predictive Check 100 Probability density functions of the ratio : 0.05 0 0 0 0.005 0.01 0 0.001 0.002 0.003 0.04 KED R • For 4 typical designs, predicted ratio from : • posthoc estimated parameters ( , ) and • randomly drawn parameters ( , ) 5 25 0.03 4 20 3 15 0.02 • Ultimate validation • Dispersion plots and histograms (Figure 1) • Individual fits (Figure 2) • “Posterior Predictive Check” (Figure 3a, b) • Minimum number of patients (Figure 4) 2 10 0.01 1 5 • Conclusion • The model is built from Phase III data : • two drugs (D+C) in combination, • resistance parameter common to both drugs and acting by increasing proliferation term (selection of resistant cells by the treatment), • interaction term not estimated (assumes additive effects). • This model can be used to predict therapy efficacy in a future clinical trial [6] : • using Bayesian approach, • a minimum number of patient seems to be necessary, but small sample sizes typical to those in early clinical studies (e.g. 50 patients) may be enough, • instead of K-PD, a PK-PD model would supply consistent information. 0 0 0 0 0.2 0.4 0 0.05 0.1 0.15 40 60 80 Figure 4. Minimum number of patients (Probability density functions of model parameters) • Samples were obtained from 100 random permutations of the 222 patients data in the phase III combination study. • 50-patients tailed samples () and • 70-patients tailed samples (). • Covariance matrix obtained : 26/100 with 50 patients and 38/100 with 70 patients. Flow chart for model development References: [1] Blum JL, Jones SE, Buzdar AU, et al: Multicenter Phase II Study of Capecitabine in Paclitaxel-Refractory Metastatic Breast Cancer. J. Clin. Oncol. 17: 485-493, 1999. [2] Blum JL, Dieras V, Mucci Lo Russo P, et al: Multicenter, phase II study of capecitabine in taxane pretreated metastatic breast carcinoma patients, Cancer 92:1759-1768, 2001. [3] O’Shaughnessy J, Miles D, Vukelja S et al. Superior survival with capecitabine plus docetaxel combination therapy in anthracycline-pretreated patients with advanced breast cancer: Phase III trial results. J. Clin. Oncol. 12: 2812-2823, 2002. [4] Iliadis A, Barbolosi D: Optimizing drug regimens in cancer chemotherapy by an efficacy-toxicity mathematical model. Comput. Biomed. Res. 33:211-226, 2000. [5] Claret L, Girard P, Zuideveld KP, et al: A longitudinal model for tumor size measurements in clinical oncology studies. PAGE 15 (abstract 1004), 2006a [www.page-meeting.org/?abstract=1004]. [6] Claret L, Girard P, O'Shaughnessy J et al: Model-based predictions of expected anti-tumor response and survival in phase III studies based on phase II data of an investigational agent. Proc. Am. Soc. Clin. Oncol, 24, 307s (abstract 6025), 2006b.