
Impact of Cattle Diet and Housing on Anaerobic Digestion of Finishing Cattle Manure
This study investigates the effects of dietary composition and housing conditions on the nitrogen-rich manure from cattle fed with Distillers Grains with Solubles (WDGS) compared to corn-based diets. Results indicated a significant increase in methane production potential in WDGS manure, although three digesters failed due to ash buildup. The microbial community analysis revealed variations in eubacteria and archaea populations, suggesting dietary changes can manipulate methane production. Overall, findings highlight the potential for optimizing anaerobic digestion through dietary management.

Impact of Cattle Diet and Housing on Anaerobic Digestion of Finishing Cattle Manure
E N D
Presentation Transcript
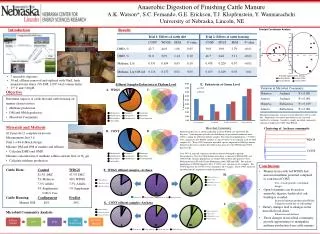
Anaerobic Digestion of Finishing Cattle ManureA.K. Watson*, S.C. Fernando, G.E. Erickson, T.J. Klopfenstein, Y. Wanniarachchi University of Nebraska, Lincoln, NE Introduction Results Conclusions Manure from cattle fed WDGS had increased methane potential compared to corn based CONT Two 6 week periods, switchback design Open lot manure can be used as anaerobic digester feedstock if ash buildup is avoided Increased methane produced/g OM fed 3 digesters failed due to ash buildup Dietary changes lead to changes in the microbial food chain Eubacteria and Archaea These changes in microbial community provide opportunities to manipulate methane production from cattle manure • 7 anaerobic digesters • 50 mL effluent removed and replaced with 50mL fresh manure/water slurry (9% DM; 1/20th total volume daily) • 37° C and 7.00 pH Effluent Samples-Eubacteria at Phylum Level C. A. WDGS Objective Determine impacts of cattle diet and cattle housing on manure characteristics: Methane production DM and OM degradation Microbial Community Materials and Methods 42 d periods (2 complete turnovers) Measurements last 5 d Trial 1 = Switchback design Measure DM and OM of manure and effluent Calculate DMD and OMD Measure concentration of methane within constant flow of N2 gas Calculate methane production Cattle Diets: ControlWDGS 82.5% DRC 47.5% DRC 5% Molasses 40% WDGS 7.5% Alfalfa 7.5% Alfalfa 5% Supplement 5% Supplement 0.986% Urea Cattle Housing:ConfinementFeedlot Manure OM 88% 26% Microbial Community Analysis Microbial community structure reveals differences due to cattle diet. Populations of archaea and eubacteria are clustered together by treatment. Sample to sample microbial community variation is higher for CONT than WDGS. Microbial Community Eubacterial diversity is shown at phylum level for WDGS (A) and CONT (B) digesters. Venn diagrams describe the distribution of operational taxonomic units (OTUs) among the different effluent samples. For eubacterial populations, 177 OTUs were common to all 4 WDGS samples (C) and 47 OTUs were common to all 4 CONT samples (D). These OTUs represent microbial species important to OM degradation. Eubacteria diversity is further described at the genus level for WDGS and CONT digesters (E). Over 99% of archaeal sequences in both treatments belonged to phylum Euryarchaeota. Class level distribution of archaea is shown for WDGS (FII) and CONT (GII). Archaea populations are further broken down into genus level for Methanobacteria(FI and GI) and Methanomicrobia(FIII and GIII). For archaea populations in WDGS digesters (H) 137 OTUs were common to all 4 samples. For CONT digesters (I) 87 OTUs were common to all 4 samples. These OTUs represent microbial species important to methane production. Clustering of Archaea community D. B. CONT WDGS CONT F. WDGS effluent samples--Archaea H. I. II. III. G. CONT effluent samples--Archaea I. I. II. III.


