Download
1 / 25
250 likes | 369 Views
Financing the Smart Grid: Costs, Rates, and Public Policy. Richard Cowart IEA ENARD – Madrid September 28, 2010. RAP Regulatory Assistance Project.

E N D
Financing the Smart Grid: Costs, Rates, and Public Policy Richard Cowart IEA ENARD – Madrid September 28, 2010 Website: http://www.raponline.org
RAP Regulatory Assistance Project RAP is a non-profit NGO providing technical and policy assistance to government officials on energy and environmental issues. RAP is funded globally by several foundations and government agencies. Over two decades, RAP has assisted more than 24 nations and 50 states and provinces, and now works closely with the European Climate Foundation in Brussels. Richard Cowart is the Director of European Programmes for RAP, and Chair of the Electricity Advisory Committee of the US Dept of Energy. Formerly Chair of the Vermont PSB (utilities regulator) & Chair of the US Regulators’ Committee on Energy & Environment. Recent assignments include work with the UK Department of Energy and Climate Change, Ireland’s SEAI, the US Congress, the Regional Greenhouse Gas Initiative (RGGI), the California PUC, China’s national energy and environmental agencies, the NARUC Climate Policy Task Force, and the US Department of Energy.
Topics for today • Smart Grid: expensive distraction, or essential low-carbon enabler? • Financing the smart grid: what will it cost? • Financing the smart grid: who pays? regulatory policies for risk, fairness • Emerging practice in the US • Smart policies for the smart grid
Potential Smart Grid benefits • Reduced labor costs (esp with AMI) • Enhanced reliability, quicker response • Peak-load management • Conservation -- Reduced end-use consumption and GHG emissions • But note: benefits from basic end-use efficiency often greater, and at lower cost • Ability to interconnect, balance and deliver high % renewables for power supply • Ability to control (”dispatch”) large new loads • e.g., heat pumps and electric vehicles.
Evolving views of the Smart Grid in the US EARLIER VIEW : “Expensive distraction” • “Smart Meters – Dumb Utilities” headlines • AMI doesn’t change anything except utility payrolls; • Just an easy way to build ratebase in a recession; • Customers hate Time of Use rates anyway. EMERGING : “Essential Component of Low-Carbon Grid” • Reliability MUST be maintained • Wide-area grid management for renewables integration • ~20% of load must be dispatchable to balance renewables in a high-RES portfolio • “Smart-charging” electric transport is a must; • Smart meters enable rate designs for lower bills. BUT – We’re not anywhere close yet! • Small fraction of Smart Grid in place, • “Smart Policies” even further behind what is needed
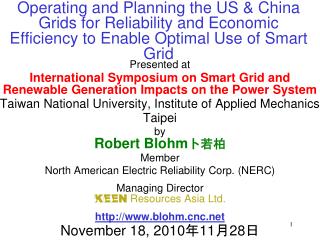
4 Efficiency flattens demand growth, ‘fuel shift’ drives it back up to the same level as ‘BAU’ –With much lower emissions, less energy-intensive ~4650 4,500 200 3,275 3,210 Electricity demand 2005 Extrapo- lated power demand 2050 Buildings Industry Power genera-tion before fuel shift EVs in transport1 Buil- dings2 Industry3 Net power demand 2050 Efficiency Fuel shift EU-27 power demand, TWh per year 1 Assumption: electrification of 100% LDVs and MDVs (partially plug-in hybrids); HDVs remain emitting ~10% while switching largely to biofuel or hydrogen fuel cells 2 Assumption: 90% of remaining primary energy demand converted to electricity usage in buildings for heating/cooling from heat pumps; assumed to be 4 times as efficient as primary fuel usage 3 Assumption: 10% fuel switch of remaining combustion primary energy demand converted to electricity in industry for heating from heat pumps; assumed to be 2.5 times as efficient as primary fuel usage SOURCE: European Climate Foundation Roadmap 2050 April 2010
4 Increased interconnectivity across regions exploits natural counter-cyclicality of primary European RE resources Overview of yearly energy balance, 80% RES pathway, TWh per week Overall system peak demand in winter Higher wind in winter 1 Higher solar in summer 1 Storage included in the model relates to the existing hydro storage available across the regions SOURCE: Team analysis
4 Demand response reduces grid and related investments, minimizes low-carbon resource curtailment, minimizes cost RES curtailment Pathways DSM Transmission Back-up and balancing % 80% RES 10% CCS 10% nuclear 3 0% 20% 2 2 60% RES 20% CCS 20% nuclear 0% 1 20% 40% RES 30% CCS 30% nuclear 2 0% 2 20% Transmission & additional generation requirements by 2050 (GW)
Financing the US Smart Grid – How much will it cost? • Context: The US will spend ~ $1.5 Trillion between 2010 and 2030 on power infrastructure (with or without Smart Grids) • Compare to ~$700 Billion total plant today • Smart Grid (2010 to 2030) will cost : • $100 Billion (US DOE Secretary Chu) • $165 Billion (Electric Power Research Institute) • Compares to ~50 years’ spending on end-use efficiency by all US utilities combined. • Recent annual spending on EE is about $3.5 billion/year
US Smart Grid Milestones • Energy Policy Act 2005 (EPACT) • Mandate to state energy regulators to study smart meters for residential and small business users • Energy Independence and Security Act 2007 (EISA) • Requires Smart Grid policy rulemaking (including interoperability standards) by FERC • Economic Recovery Act 2009 (ARRA) • Large US grants for SG investments on a shared-cost basis • Smart Grid finance now from three main sources: • US Government grants (esp ARRA) • Federal transmission tariffs (FERC) • Utilities under state PUC authority (in retail rates)
(A) $3.5 Billion in Direct Federal Funding Funding (millions $) • Smart Grid Investment Grants - $3,400 • Smart Grid Regional Demonstrations - $615 • Standards/Interoperability Framework - $10 • Some funding for state regulators ($50) and state planning ($55) is for SG
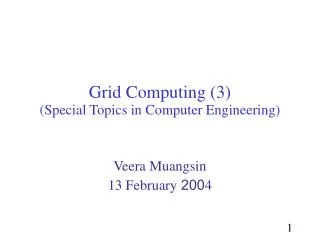
Many ARRA Funded Smart Grid Projects Underway in the US Today
(B) Smart grid finance –Issues in utility regulation • Benefits and costs -- Is the investment prudent? • Should ratepayers also pay for early-retired meters and equipment ? The “used and useful” problem. • How to recover both old and new costs? • Rolled into rates or surcharges? Enhanced ROE? • Shared savings or performance conditions? • Who should pay? (Rate design questions) • Should utilities be at risk for bad technology, bad management, or bad outcomes?
Who has jurisdiction over smart grid investments? • US Federal Power Act: • National regulator (FERC) has authority over transmission and wholesale markets; • State regulators have authority over distribution, retail sales and tariffs, power supply and resource/efficiency choices, • Which elements of the “smart grid” are recoverable in FERC tariffs, which in state tariffs, which in markets alone?
Smart Grid Finance (C)FERC’s Policies • EPACT 2005: “The Commission shall establish, by rule, incentive-based …. rate treatments …. by public utilities for the purpose of benefiting consumers by ensuring reliability and….reducing transmission congestion.” • “The rule shall…provide a return on equity that attracts new investment in transmission facilities (including related transmission technologies).” • Interim Rate Treatment under EISA also in effect now. • FERC Order 679 -- will allow cost recovery and other benefits for transmission projects using “advanced technologies”: • Financial benefits include accelerated depreciation, CWIP, an enhanced rate of return, cost recovery of abandoned plant, single-issue rate cases, and others • Example : +150 basis points for investments in MAPP - 500kv underwater cable with “smart grid” aspects allowing the system operator to manage the line more effectively
California – proactive PUC, financing in rates • 2004 California PUC directed utilities to prepare a business case for AMI • 3 major IOUs plans: $4.3 Billion approved • PGE: plan for 9 million meters, $1.7 Billion Supported via a 1% rate increase (2006) • But followed by requests for upgrades for HAN costing $527 million more (2007, 2009) • Consumer opposition and confusion is a problem.
Texas – regulatory pre-approval of fixed monthly charge for AMI • Texas Legislature: “net metering and advanced meter information networks” shall be deployed “as rapidly as possible” for customer choice and demand response. • Regulatory action: PUC’s Advanced Metering Rule (2007) applies to Transmission and Distribution Service Providers: • Cost recovery is through a monthly fixed charge per meter of $2.19 to $3.25/month, on a long-term basis (out to 2020). • Utility plans and investments as of May 2010: • Oncor – Plan to spend $839 million. About one million meters out of planned 3.4 million already installed. Customer education and low income support included in plan. • CenterPoint -- Plan totals $847 million. About 450,000 meters installed to date, 2 million planned. • AEP Texas began deployment in November 2009, and as of May 2010 approximately 16,000 meters were deployed.
Vermont: preapproval, reducing utility risk • Legislative mandate to investigate AMI; • Vt PSB ruling 2008 • Preapproval of utility plans, means: • Full return of, and on, advanced tech; • Full recovery of retired assets, over time, with accelerated depreciation; • AMI assets will be deemed “used and useful” • Note: 2009 ARRA grant will pay ½ of the $138 million cost.
Maryland: leaving more risk with the utility • Baltimore Gas & Electric (BGE) proposal: • $835 million investments • Requested automatic recovery from ratepayers via a “tracker” • 10-year depreciation period • Maryland PSC: proposal denied • No rate recovery until systems installed • Costs accrue as a “regulatory asset” recovered when benefits demonstrated
Peak reduction varies GREATLY across 70 different pricing & technology combinations Source: Ahmad Faruqui, Dynamic Pricing and Customer Behavior, The Brattle Group March 2010
“Smart Policies” Also Needed to Deliver Clean Energy and Consumer Benefits • Smart grid is only an enabler. • Smart grid will not increase energy efficiency, renewable energy or emissions reductions without smart policies. • Work needed on specifictechnologies, programs, customer options needed to get potential SG benefits • E.g.,What are the best rate designs for efficiency? • Worse yet, without the right policies, smart grid may divert attention and funds from clean energy investments needed today. • E.g., RPS for new clean generation, Emission Performance Standards, end-use efficiency programs , secure transmission access for renewables, market rules for low-emission resources, etc.
For more information: Richard Cowart, Regulatory Assistance Project Email questions to rcowart@raponline.com From the Regulatory Assistance Project: • Clean First: Aligning Power Sector Regulation with Environmental and Climate Goals (September 2010) • Is It Smart If It’s Not Clean? (May 2010) • Smart Grid or Smart Policies: Which Comes First? (July 2009) Posted at www.raponline.org From the European Climate Foundation: Roadmap 2050: A Practical Guide to a Prosperous, Low-Carbon Europe (Volume 1 Report, and Volume 2 Policy Agenda) Posted at: www.roadmap2050.eu