Download

1 / 60
600 likes | 686 Views
SEMI-INTELLIGENT USE OF THE ETA MODEL - Part 1. MICHAEL ECKERT. HYDROMETEOROLOGICAL PREDICTION CENTER. CAMP SPRINGS, MD. E-MAIL ADDRESS: Michael.Eckert@noaa.gov. COMAP SYMPOSIUM 00-1 14 December 1999. Why models have forecast problems.

E N D
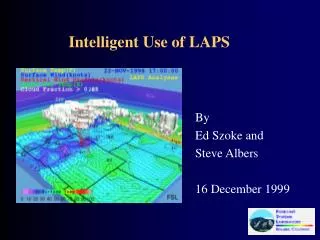
SEMI-INTELLIGENT USE OF THE ETA MODEL - Part 1 MICHAEL ECKERT HYDROMETEOROLOGICAL PREDICTION CENTER CAMP SPRINGS, MD E-MAIL ADDRESS: Michael.Eckert@noaa.gov COMAP SYMPOSIUM 00-1 14 December 1999
Why models have forecast problems • Initialization and quality control smooth data fields, but some of the lost detail may be important. • May have poor first guess • Lack of data over the oceans and Mexico. • Atmospheric processes are non-linear; small changes in initial conditions can lead to large forecast variations (this is the basis for ensemble forecasting). • Model physics are approximations • for lower resolution models, convection is parameterized • for higher resolution models the micro-physical processes are parameterized
INTELLIGENT USE OF THE MODEL REQUIRES THAT THE FORECASTER • COMPARE THE INITIAL 00HR FORECAST WITH DATA • BE FAMILIAR WITH CHARACTERTIC MODEL ERRORS AND BIASES. • HAVE A ROUGH UNDERSTANDING OF HOW APPROXIMATIONS OF THE PHYSICS MAY NEGATIVELY IMPACT A FORECAST.
The performance characteristics of the eta have changed dramatically during the past year. • QPF forecasts during the past winter deteriorated when compared to the AVN or NGM. • ETA surface and 500 mb forecasts have also been worse compared to the other models. • April 1999 ETA 500 h and 250 mb forecasts usually verified worse than the AVN.
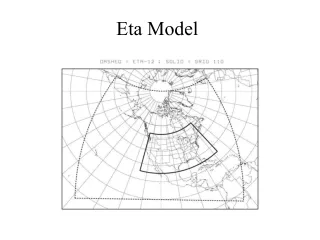
32-km terrain Know the difference between model and real terrain!
DESPITE ITS RECENT PROBLEMS, THE ETA IS STILL USUALLY BETTER THAN THE AVN OR NGM FORECASTING PRECIPITATION OVER COMPLEX TERRAIN DURING WINTER IN A ZONAL PATTERN. 12-36 H ETA V.T. 12Z 3 JAN 97 ANALYSIS V.T. 12Z 3 JAN 97 12-36 H NGM V.T. 12Z 3 JAN 97 Note that the Eta max in California is a little too far west. It also often under predicts precipitation over the Siskiyou Mountains of northern California.
Eta Model Physics • Eta model calculates grid-scale precipitation using a simplified explicit cloud water scheme • includes super-cooled water, simplified snow processes and the advection of cloud water and cloud ice • but does not include horizontal advection of snow and rain. • In fast flow snow can advect 50 to 100 km downwind of its source region (Rauber, 1992)
EXPLICIT CLOUD PREDICTION SCHEME (large scale) • Cloud condensation is allowed to occur when the RH reaches a critical value • Cloud evaporation is allowed to take place only when the RH falls below the critical value • 70% over land, 80% over water • the difference in the critical value between land and water can produce discontinuities along the coast • this may be one of the reasons the Eta over predicts cold season precipitation along the Gulf and Atlantic Coasts.
The BMJ Convective Scheme • 1st looks for deep convection • step 1 is to look for most unstable layer within the lowest 130 mb • Next calculates LCL to get cloud base • then lifts parcel to Equilibrium Level to get cloud top • then looks to see if the cloud layer is at least 290 mb in depth • If the cloud is not 290 mb then it searches for shallow convection
More about the BMJ scheme • then develops sounding based on a reference profile. • The important thing to remember about the profile is it will not allow the sounding to become completely saturated. • The saturation pressure deficit is found for three levels (cloud base, freezing level and cloud top) and the final reference profile based on the type of cloud efficiency • Saturation pressure deficits are then found for other points along the profile • when the saturation pressure deficits are exceeded, the moisture produces rain. • however, the amount of rainfall must be in balance with the latent heating.
The BMJ scheme • Was developed for tropical systems • does not handle elevated convection well • the convection may not extend through a deep enough layer • does not develop realistic downdrafts/outflow boundaries • therefore, during summer it sometimes predicts the convective development too far north • the saturation pressure deficits in the scheme are different over land and water
THE ETA OFTEN FORECASTSTOO MUCH RAINFALL NEAR THE GULF AND SOUTHEAST COASTS BECAUSE OF THE PROBLEMS WITH THE WAY THE ETA HANDLES THE LAND-SEA INTERFACE 12-36 HR PRECIPITATION FORECAST V. T. 12Z 1 APR 24 HR PRECIPITATION ANALYSIS V. T. 12Z 1 APR
FOR ANY MODEL, ALWAYS BEWARE OF THE 1ST GUESS 00 HR ETA SURFACE AND 1000-500 MB THICKNESS V.T. 00Z 3 SEP 1998 00 HR ETA 500 MB HEIGHT AND VORTICITY V.T. 00Z 3 SEP 1998 SURFACE ANALYSIS V.T. 00Z 3 SEP 1998 TROPICAL STORM EARL WAS LOCATED JUST SOUTHWEST OF THE FLORIDA PENINSULA. THE 1ST GUESS WILL SOMETIMES OVERRIDE DATA WHEN INTENSE SMALL SCALE FEATURES ARE PRESENT.
WHAT HAPPENED? THE MRF 1ST GUESS FIELD TRIED TO DRAW TO THE DATA BUT THE FIRST GUESS FIELD OVERWHELMED IT. IF NCEP HAS A COMPUTER FAILURE, THE ETA DATA ASSIMILATION MAY BE CANCELLED AND THE ETA MAY RUN ON AN EARLIER GLOBAL MODEL 1ST GUESS
A POOR INITIAL ANALYSIS CAN PRODUCE HUGE FORECAST ERRORS ETA 48 HR V.T. 00Z SEP 5 ETA 48 HR V.T. 00Z SEP 5 EARL EARL EARL EARL ETA 00 HR V.T. 00Z SEP 5 ETA 00 HR V.T. 00Z SEP 5
IN THE PAST, ETA MODEL HAS HAD PROBLEMS PREDICTING THE STABILITY. PROBLEM IS OFTEN TIED TO THE 1ST GUESS HIGH SOIL MOISTURE CASE WHEN SOIL MOISTURE IS HIGH, THE ETA DEWPOINTS ARE TOO HIGH AND LOW-LEVEL TEMPERATURES ARE TOO LOW. THE ETA FORECAST CAPE=1177, LI=-4 OBSERVED CAPE=5, LI=2 THIS SOMETIMES CAUSES THE MODEL TO BE TOO UNSTABLE FORECAST OBSERVED
OBSERVED ETA FORECAST WHEN HIGH SOIL MOISTURE IS PRESENT, OR WHEN THE MODEL FIRST GUESS THINKS THE SOIL MOISTURE IS HIGH, THEN, THE MODEL FORECASTS SURFACE DEWPOINTS TOO HIGH AND SURFACE TEMPS TOO LOW. 32 SURFACE TEMPERATURE 28 24 20 24 DEWPOINT TEMPERATURE 20 16 12 1024 1020 SURFACE PRESSURE 1016 1012 THE MODEL UNDERPREDICTS THE BOUNDARY LAYER WINDS. HOWEVER, MODEL FORECASTS OF 850 MB WINDS ARE OFTEN TOO STRONG 18/00 18/06 18/12 18/18 19/00 19/06 19/12 19/18 20/00
WHEN LOW SOIL MOISURE IS PRESENT DURING SUMMER OVER THE HIGH PLAINS, ESPECIALLY WEST TX, THE FORECAST CAPE IS TOO LOW
OBSERVED ETA FORECAST WHEN SOIL MOISTURE IS LOW IN SUMMER IN THE PLAINS, THE SURFACE DEWPOINT IS TOO LOW AND THE TEMPERATURE IS TOO HIGH THE DEWPOINTS IN THE PLAINS AND SOUTHWEST WERE TOO LOW THIS SUMMER OKLAHOMA CITY 36 SURFACE TEMPERATURE 32 28 24 20 20 DEWPOINT 16 TEMPERATURE 12 1016 SURFACE PRESSURE 1008 ETA SURFACE WINDS WERE TOO WESTERLY, WAS THERE TOO MUCH DOWN-SLOPE? 19/00 19/06 19/12 19/18 20/00 20/06 20/12 20/180 21/00 MAY 1998
Line x=y Line x=y Forecast precipitation 1 - less than .25” 2 - more than .25” Forecast -Vs- Observed Best CapeSpring 96 Note the large spread. The model stability forecasts are worst when precipitation is forecast
MORE ON ETA PERFORMANCE • TOO WET IN FLORIDA • SOMETIMES OVERDEVELOPS LOW-LEVEL JET • HAS BEEN TOO FAST BRINGING SHORTWAVES THROUGH THE ROCKIES INTO THE PLAINS. • HAS BEEN TOO FAR SOUTH WITH CLOSED LOWS COMING EASTWARD INTO THE PLAINS • OVERFORECASTS THE STRENGTH OF ANTICYCLONES • HAS PROBLEMS INITIALIZING TROPICAL SYSTEMS
ETA AND STORM TRACKS DURING 1999 TENDED TO BE TOO FAR SOUTH WITH LOWS AS THEY REFORMED EAST OF ROCKIES. THIS ERROR USUALLY CONTINUED UNTIL THE LOW MOVED EAST OF THE MISSISSIPPI RIVER. BY CONTRAST, THE AVN IS SOMETIMES TOO FAR NORTH TENDS TO SOMETIMES TRACK LOWS TOO FAR NORTH AND WEST WITH LOWSALONG THE EAST COAST. ESPECIALLY DURING MAJOR CYCLOGENESIS WHEN A COASTAL TROUGH IS PRESENT
COMMON ETA ERROR ALONG EAST COAST WHEN A CLOSED UPPER LOW APPROACHES THE COAST THE ETA SOMETIMES HAS PROBLEMS FORECASTING THE LOCATION OF THE SURFACE LOW. NOTE WHERE THE UPPER LOW IS CENTERED AND WHERE THE STRONGEST UPPER-LEVEL DIVERGENCE IS IMPLIED. 48 H ETA 500H V.T. 12Z 23 APR 98 48 H NGM 500H V.T. 12Z 23 APR 98 Based on the 500 h and vorticity pattern, where would you predict the surface low?
NOTE THAT THE ETA SURFACE LOW IS A LITTLE WEST OF ITS 500 MB CENTER. THE NGM HAS A MUCH BETTER FIT TO THE 500 MB PATTERN. THE STRONG EASTERLY COMPONENT TO THE WINDS NORTH OF THE ETA MODEL LOW ALLOWS IT TO WRAP MOISTURE AND PRECIPITATION TOO FAR WEST 48 H ETA SURFACE V.T. 12Z 23 APR 98 48 H NGM SURFACE V.T. 12Z 23 APR 98
THE LOW VERIFIES A LITTLE NORTH AND EAST OF THE NGM. REMEMBER, THE NGM IS TYPICALLY TOO SLOW WITH LOWS ALONG THE COAST. VERIFYING SURFACE V.T. 12Z 23 APR 98 VERIFYING 500H V.T. 12Z 23 APR 98 L ETA SURFACE LOW
When the NGM and AVN sheared 500 troughs approaching the east coast in 1999, the eta often amplified the trough and overdeepened the surface low. An example: 48 HR ETA 500 48 HR ETA SFC 48 HR NGM 500 48 HR NGM SFC
The Eta predicted a major east coast snowstorm. The NGM and AVN predicted light snow at best 36-48 hr ETA precipitation 36-48 hr NGM precipitation
HOW THE MODEL VERIFIED. NO MAJOR SNOWSTORM DEVELOPED. 48 HR ETA 500 VERIFYING 500 MB 48 HR NGM 500 VERIFYING SFC
LOWS TO THE LEE OF THE ROCKIES • THE AVN AND NGM USUALLY PREDICT THEM TO FORM TOO FAR NORTH • THE ETA IS SOMETIMES A LITTLE TOO FAR SOUTH • USE THE 300 MB UPPER LEVEL JET. THE SURFACE LOW IS USUALLY FOUND IN THE LEFT EXIT REGION OF THE JET, USUALLY JUST TO THE NORTH
28 ETA model runs were evaluated during the period from 00Z March 30-12 Z April 13. During the entire period the mean 500h pattern was similar to the one shown below. A RIDGE AND POSITIVE ANOMALY NEAR 160W, BELOW NORMAL HEIGHTS OVER ALASKA AND A TROUGH NEAR OF JUST INLAND FROM THE WEST COAST WITH BELOW NORMAL HEIGHTS EXTENDING EASTWARD INTO THE SOUTHWESTERN U.S. THE ETA SHOWED A CONSISENT CHARACTERISTIC ERROR DURING THE PERIOD. THE NEXT FEW SLIDES WILL DESCRIBE THE ERROR
As the upper trough digs into the west the ETA did not dig the shortwaves strongly enough once the trough reached the ca coast. Note how much lower the heights are across NV and CA. 48 hr ETA valid 00Z 1 April 00 hr eta valid 00Z 1 April
The eta underplays the second shortwave diving into the mean trough and overplays the first one. 48 hr ETA 500 h and vorticity v.t. 12Z 4 April 00 hr ETA 500 h and vorticity v.t. 12Z 4 April THE ETA PREDICTED THE UPPER LOW ASSOCIATED WITH THE FIRST SHORTWAVE TOO FAR SOUTH AND EAST IN THE PLAINS. INSTEAD THE INITIAL SHORTWAVE LIFTED MORE TO THE NORTH BEFORE BEING FORCED EASTWARD. THIS HAPPENED SEVERAL TIMES DURING THE STUDY.
The eta was generally too fast and far southeast with the 500h low over the Plains with 120 meter errors over MO and IA. This can have a very serious impact on frontal speed and on the position of the low level convergence and resulting convection. 546 558 00 hr Eta v.t. 12Z 10 Apr 48 hr Eta v.t. 12Z 10 Apr
The Eta surface low and associated fronts can also be affected. The slower eastward movement of the ridge axis may allowed for the flow along the east to be more northwesterly which allowed the surface boundary to sink farther to the south 48 hr Eta v.t. 12Z 10 Apr 00 hr Eta v.t. 12Z 10 Apr
Why models have problems with arctic airmasses • Terrain is averaged • Initialization process sometimes robs shallow airmass of its coldness • Models have problems handling the strength of the inversion • The sigma coordinate system, the Eta coordinate system does better • The leading edge of the ETA LI gradient is often the best indicator of the frontal position
36 HR AVN V.T. 00Z APR 09, 1995 THE NGM AND AVN/MRF HAVE SERIOUS PROBLEMS WITH ARCTIC AIRMASSES. L 36 HR NGM V.T. 00Z APR 09, 1995 AVN ANALYSIS V.T. 00Z APR 09, 1995 TEMPERATURES ACROSS KANSAS WERE IN THE LOW TO MID 50s WITH STRONG NORTH WINDS. SOUTH OF THE FRONT TEMPERATURES WERE IN THE UPPER 70s TO LOW 90s. PRIOR TO THE 1998-99 WINTER SEASON ,ETA USUALLY HANDLED ARCTIC AIR MASSES BETTER.
WHEN USING MODELS, PATTERN RECOGNITION REMAINS IMPORTANT! VALID AT BEGINNING OF PERIOD MSL, THICKNESS AND 850 WINDS PRECIPITABLE WATER (INCHES) AND 850 MB WINDS SEVERAL THINGS TO NOTE: 1) A LONG FETCH OF DEEP MOISTURE, 2) A BARRIER JET AND STRONG SOUTHERLY FLOW UP THE SACREMENTO VALLEY. THIS JET HELPS PRODUCE HEAVY RAINS NEAR SHASTA, 3) STRONG WARM ADVECTION.
DO THE FORECASTS LOOK CONSISTENT WITH WHAT YOU SEE IN THE PACIFIC? CHECK SSMI DATA VALID AT THE END OF THE PERIOD PRECIPITABLE WATER (INCHES) AND 850 MB WINDS MSL, THICKNESS AND 850 WINDS
OVERLAYING MODEL OUTPUT WITH SSMI IMAGERY CAN GIVE YOU A GOOD IDEA OF THE MOISTURE THAT WILL BE FEEDING INTO THE WEST COAST. THE MODEL OUTPUT LOOKS REASONABLE NOTE THE TROPICAL CONNECTION AND PLUME OF PWS ABOVE 1.00”
THE MODEL’S TERRAIN IS AVERAGED OVER THE GRID BOX SO THE SLOPE OF THE TERRAIN IS USUALLY NOT STEEP ENOUGH THIS CAUSES THE VERTICAL MOTION FIELD TO BE SHIFTED AWAY FROM THE MOUNTAINS
THINGS TO REMEMBER ABOUT MODEL QPFS IN COMPLEX TERRAIN DURING WINTER BECAUSE OF THE SIMPLIFIED MICROPYSICS AND INADEQUATE RESOLUTION OF MOUNTAINS. MODELS USUALLY: 1) PREDICT PRECIPITATION TOO FAR WEST AWAY FROM MOUNTAIN PEAKS 2) DO NOT ALLOW ENOUGH PRECIPITATION ON THE IMMEDIATE DOWNWIND SIDE OF MOUNTAIN RANGES
32 KM ETA TERRAIN 24 HOUR PRECIPITATION VALID JAN. 9, 1995 WITH STRONG VERY MOIST SOUTHWESTERLY FLOW AT 850 AND 700 MB NOTE HOW CLOSELY THE PRECIPITATION CONFORMS TO THE TERRAIN WHEN SOUTHWESTERLY FLOW IS PRESENT A BARRIER JET FORMS AND FUNNELS THE FLOW UP THE SACREMENTO VALLEY.
IF THE MODEL IS SO DRY DURING THE SUMMER IN THE PLAINS, HOW DO I USE IT? WARM FRONT? USING PATTERN RECOGNITION AND KNOWLEDGE OF TYPICAL MODEL ERRORS. DOES THIS LOOK LIKE A MADDOX FRONTAL TYPE EVENT?
BOUNDARY LAYER WIND AND TEMPERATURE FORECAST V.T. 00Z 18 JULY THE BLUE LINE INDICATES A THERMAL BOUNDARY THAT SHOWS UP IN THE FORECAST
A STRONG LOW LEVEL JET IS PRESENT WITH LOTS OF MOISTURE. THIS IS A TYPICAL MADDOX TYPE SET UP. IS IT TIME TO CALL EMERGENCY MANAGERS? FOR WHICH STATE? MINNESOTA? WISCONSIN? IOWA? ILLINOIS?
OOZ 18 JULY FORECASTS OF 250 JET AND DIVERGENCE BEST LI AND BOUNDARY LAYER WINDS A SHORTWAVE AND JET STREAK IS APPROACHING THE RIDGE. UNSTABLE LIS ALONG SURFACE BOUNDARY
IS THIS A GOOD QPF? DO YOU THINK THE RAINFALL IS ORIENTED CORRECTLY WHICH WSFOS NEED TO CONTACT EMERGENCY MANAGERS?
DURING SUMMER THE ETA IS OFTEN UNDERPLAYS THE PRECIPITATION ASSOCIATED WITH MCCS. IT ALSO OFTEN PREDICTS ITS RAINFALL MAXIMUM TOO FAR NORTH BECAUSE IT CANNOT HANDLE OUTFLOW BOUNDARIES, OR IN THIS CASE THE LAKE BREEZE. HOW DID YOU DO? MODEL FORECAST OBSERVED 6” OR MORE 3” OR MORE 1” OR MORE
VERIFYING PRECIPITATION • BIAS=FORECAST/OBSERVED • EQUITABLE THREAT=(H-E)/(F+O-H-E) • THREAT SCORE=H/(F+O-H) • N=NUMBER OF HITS, F=NUMBER OF GRID POINTS FORECAST, O=GRID POINTS OBSERVED, E=(F*O)/N