Data treatment EDIC-CEDEC Model
This document addresses the challenges of parcels belonging to multiple irrigation sectors and proposes a method to assign each parcel to its primary irrigation sector based on the strongest relation. It also discusses the integration of GIS data for model processing, the significance of various external variables, and the sensitivity of model outputs to changes in parameters. Furthermore, it explores model coupling, calibration techniques, and strategies for understanding how input variations impact output uncertainties across interconnected models.


Data treatment EDIC-CEDEC Model
E N D
Presentation Transcript
Data treatmentEDIC-CEDEC Model Thorsten Arnold
Problem: - Parzellas belong to multiple Irrigation sectors • Solution: • Identify parcels belonging to Multiple sectors • - Assign parcel to irrigation sector With largest relation New problems … - Roads and rivers defined as poligons, just like plots … Aufarbeitung von GIS-Datenfür Import nach C++
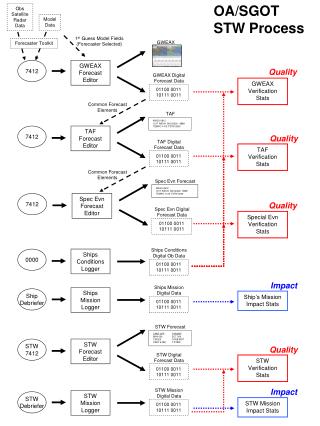
Assumptions on external variables („World Scenario“) PA Mod A Mod C Mod B PA↔ C PA ↔ B PB↔C PB PC Model Coupling & Sensitivity Analysis
Mod B Mod A Mod C Data XML - Kernel GUI Another model setup …Same problem for sensitivity analysis ?!?
Economic Agents WaSiM CropWAT Data XML - Kernel GUI Looking Foreward … one option Channel System
Economic Agents WaSiM CropWAT Data XML - Kernel GUI Looking Foreward … another option Channel System
Model as „blackbox“ Input Output With: X input vectorY ouput vectorΩk-dim space of input factorsςmoment Realization of random variable Y Summary Statistics: <Y (ς) > = ∫ gς (X,P) p(X,P) dX Ω Calibration & Sensitivity Y= f( X,P ) Distributed input data X pdf : p (X) = p (X1, X2, …, Xi) (assumed to be known)
Parameter space & Response surface How do changes in P affect model outputs Y ( P )? • Model results do not depend on one parameter P1. (no „turning importance“! ) • Is model redundant in P1 ?(check „reducing importance“! ) • Model results sensitive to both parameters P1 and P2
Gradient Sensitivity Local sensitivity in parameters Importance for calibration P1(-1, 1.4) P2(0.3,0) P3 (-0.1,-0.7) Sensitivity to parameters changes with P ! Problem: How does my „response surface“ look like?
Sensitivity (V): ScreeningNumeric screening experiments • Control experimentVary no factors: baseline run Y (P), with P = [P1, P2, …, PN] • One-at-a-time (OAT) screeningVary one factor Pi Pi + Δ ; compare results Y (P, Pi) to control experiment Y (P) • Factorial experiment Vary all factors at the same time (random or quasi-random representative of P from pdf, such as Latin Hypercube) • Fractional Factorial experiment Vary many factors Pi, Choose intelligent methods to save run-time
Var ( Y (P)) Mean ( Y (P) ) Sensitivity (V)Moris‘s OAT design Dynamic parameters ΔP4x ΔP1x Increasing dynamic influence (interaction, nonlinearity) Linear parameters ΔP5x ΔP6x ΔP2x ΔP3x
Sensitivity & Model coupling • How does the sensitivity of one model effect the output of other models? • Which input data / parameter are responsible for most ouput variation / output uncertainty of each module? • In a coupled model, how can be dealt with parameter sensitivity in order to minimize output uncertainty?