Download
1 / 10
100 likes | 284 Views
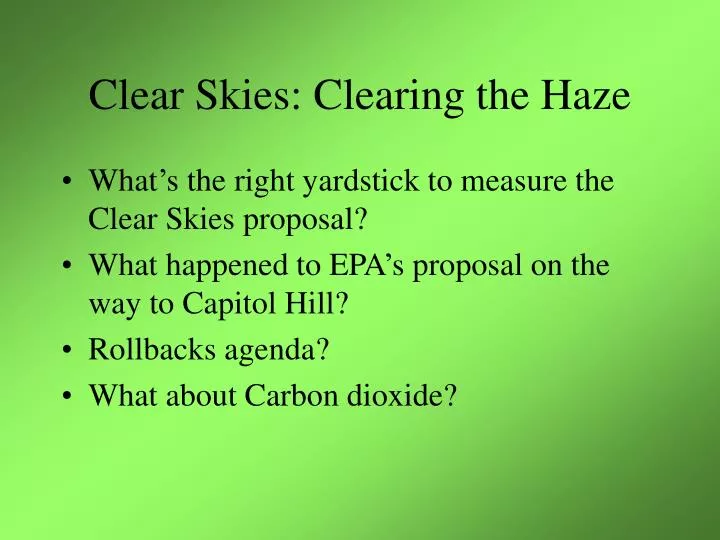
Clear Skies: Clearing the Haze. What’s the right yardstick to measure the Clear Skies proposal? What happened to EPA’s proposal on the way to Capitol Hill? Rollbacks agenda? What about Carbon dioxide?. Is “Clear Skies” Good Policy?.

E N D
Clear Skies: Clearing the Haze • What’s the right yardstick to measure the Clear Skies proposal? • What happened to EPA’s proposal on the way to Capitol Hill? • Rollbacks agenda? • What about Carbon dioxide?
Is “Clear Skies” Good Policy? • Contrary to the Bush Administration claims, its plan does not do better than current law. • But Congress’ choices are not limited to current law or the administration proposal. • The right question: How does Clear Skies fare against current competition: S.556 and EPA August 2001 Proposal? • Clear Skies is dirtier and slower than the competition.
Clear Skies v. S.556 and EPA* • From 2008-2020 Clear Skies allows-- • Nearly 100,000 additional premature deaths • 23-34 million more tons of SO2 • 7-10 million more tons of NOx • 186-284 more tons of mercury • 13 Billion more tons of CO2 * EPA August 2001 Proposal
EPA’s August Proposal • 2010 SO2 cap = 2 million tons • 2008/2012 NOx cap = 1.9/1.25 million tons • 2008/2012 Hg cap = 24/7.5 tons • Benefits include over 200,000 fewer premature deaths over 2010-2020 decade. • Monetized benefits in 2020 greater than $150 billion annually. • Compliance costs of about $11 billion annually. • Bush plan saves about $5 billion in compliance costs but loses about $50 billion in benefits.
Rollbacks: Forecast Hazy • White House rollout was hazy about changing current programs. • Since then, statements suggest a broad repeal agenda. • Anonymous administration claims that NSR enforcement is not working. • EPA AA states President will veto bill that does not repeal NSR.
Turning the CO2 Supertanker • Sound policy should preserve our options to stabilize emission concentrations at levels less than double pre-industrial levels. • BAU: likely to double pre-industrial level soon after 2050 (560 ppm) – could exceed 700 ppm by 2100, with no end in sight. • Prudent carbon budget for 21st Century is 600 billion tonnes or less. • BAU global emissions in next 30 years alone likely to be 300 billion tonnes.
4 Reasons for 4-P • Power plants are 40% of U.S. CO2 emissions – 10% of world emissions • Integrated control strategies save billions of dollars and reduce regulatory uncertainties • Market signal for gasification and geo-sequestration – coal’s only long-term future • Signal to other sectors to consider carbon in their business plans.
President’s Climate Plan • President acknowledged that CO2 growth must slow, stop, and then reverse. • Under President’s goal emissions will grow 14% in next decade – same rate as last decade. • Cannot wait 10 years to change course. • His announcement increases business uncertainty but does not spur action.
Policy Uncertainty Does Not Help Administration Graphic. Dates supplied by NRDC
Washington, DC 25 miles Climate Policy—On the Rocks? January 31, 2002 March 5, 2002