Exploring Cognitive Tension Dynamics in Mental Arithmetic Operations
This study probes into the fluctuations of cognitive tension levels during mental arithmetic tasks. The investigation utilized a dual-task approach to discern the temporal patterns of low and high cognitive tension. The findings shed light on the factors influencing cognitive tension variance and distribution, essential for understanding mental workload during arithmetic operations. EEG spectral density maps and ERP waveforms were analyzed, revealing distinctive patterns across states of ease, auditory-motor reaction, and varying cognitive loads. The research offers insights into the intricate interplay between cognitive tension levels and task complexity, with implications for cognitive load management strategies.

Exploring Cognitive Tension Dynamics in Mental Arithmetic Operations
E N D
Presentation Transcript
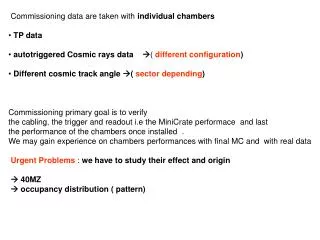
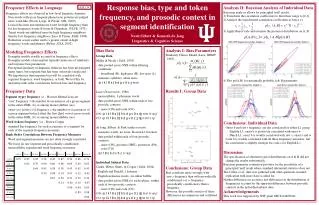
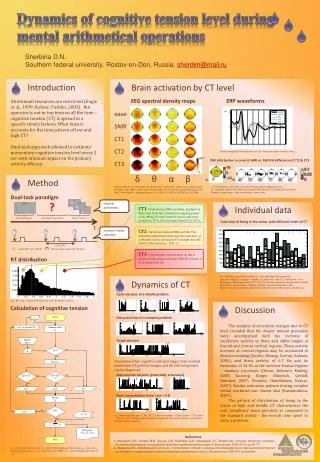
Dynamics of cognitive tension level during mental arithmetical operations Sherbina D.N. Southern federal university. Rostov-on-Don. Russia. sherdim@mail.ru Method Introduction Individual data Brain activation by CT level Discussion Dynamics of CT ease SMR CT1 CT2 CT3 EEG spectral density maps ERP waveforms Attentional resources are restricted (Engle et al., 1999; Rohrer, Pashler, 2003). But operator is not in top tension all the time – cognitive tension (CT) is spread in a specific timely fashion. What factors accounts for the time pattern of low and high CT? Dual-task approach allowed to estimate momentary cognitive tension level every 2 sec with minimal impact on the primary activity efficacy. μV SAMR Stimul CT1 CT2 CT3 s Grand-averaged ERP recorded form Fz. Ox – time from sound stimulus onset, s. CNV distribution in control SMR vs. ANOVA difference of CT1 & CT3 μV2 δθαβ A B EEG recorded form 21 references by 10-20 system. To the left – states: ease – passive state with open eyes, SMR – audial-motor reaction only; CT1-3 – dual-task, classified by cognitive load. To the bottom – frequency bands: δ – 2-4 Hz, θ – 4-8 Hz, α – 8-13 Hz, β – 13-25 Hz. A – ERP potential map in the moment of stimulus onset, negativity in red. B – confident level for the difference between ERP waveforms in states of CT1 and CT3. Numbers under maps - time from stimulus onset in ms. CT1. Predominant SMR execution. A subject is distracted from MA, attended on ongoing sound clicks. Mind is loaded with the next sound onset prediction. RT is close to usual values 0.15-0.25 s. Dual-task paradigm Total time of being in the states with different levels of CT ? mental arithmetic CT2. Partial execution of SMR and MA. The attention is distributed between two activities, so arithmetic load is not much. RT is longer, but still linked to the stimulus, - 0.25-1 s. s calculation operations answer choice task perseption t CT3. Predominant concentration on MA. A subject is fully distracted from SMR. RT exceeds 1 s or no reaction at all. sensory-motor reaction RT distribution 1.6-2.4 s - sound click 1 ms, 100 dB - mouse button press with left hand Ox – individuals marked with initials, Oy – time of being in the experiment. Dark bars – high CT3, gray bars – middle CT2, white bars – low CT1. Dashed bars – non-stable spans, which were mixes of CT1, CT2 & CT3, whose shares are divided with horizontal dashed lines. Arrows above – subjects with poor overall performance < 50%. Decision time of one problem varied from 12.7±1.5 s to 91.4±18.6 s (mean - 43.6±1.1 s). Quick decision of a middle problem s Ox – RT, s, Oy – a share of RT values for a bin. Bin width is 0.025 s. Calculation of cognitive tension Heavy decision of a complex problem The analysis of activation changes due to CT level revealed that the deeper mental processes were accompanied with the increase of oscillatory activity in theta and alpha ranges at frontal and central cortical regions. Theta activity increase at central regions may be accounted of decision making (Jacobs, Hwang, Curran, Kahana, 2006), and theta activity of 6-7 Hz and its harmonic of 14 Hz at the anterior frontal regions – memory processes (Onton, Delorme, Makeig, 2005; Sauseng, Hoppe, Klimesch, Gerloff, Hummel, 2007; Pesonen, Hämäläinen, Krause, 2007). Similar activation pattern during complex verbal workload was shown also (Razumnikova, 2007). The pattern of distribution of being in the states of high and middle CT characterizes the task complexity more precisely as compared to the standard metric - the overall time spent to solve a problem. Tough decision Sometimes when cognitive load gets bigger than residual motivation, CT pattern changes and the following states can be diagnosed. Approximate decision (potentially erroneous) Poor concentration (error rate > 0.3) Ox – time from task onset, s., Oy – RT, s. Color corresponds CT level: green – CT1, yellow – CT2, red – CT3. Numbers above mark presentations of answer variants , red numbers correspond false answers. References 1. Айдаркин Е.К., Огарев М.И, Покуль С.Ю, Щербина Д.Н., Айдаркина Е.С. Разработка методов контроля текущего состояния обучающегося в динамике решения арифметических задач // Валеология, 2006, № 4, стр. 69-77. 2. Айдаркин Е.К., Щербина Д.Н, Богун А.С. Соотношение общей и локальной активации мозга при различном уровне когнитивного напряжения во время умножения двузначных чисел // Валеология, 2008. № 1 (в печати). tUj – time of the decision end, s, ti - time of the beginning of key press, tRi– time of the beginning of key press, s, LPi – latent period of SMR, s; Tk – time of being in the state of k, s .