Download
1 / 8
80 likes | 114 Views
Dive deeper into parabolas as Conic Sections, understanding focus, vertex, directrix, and equations with helpful examples.

E N D
10-3 Parabolas What? Again?
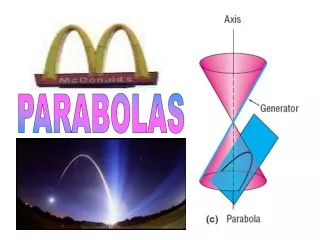
Psst – hey – didn’t we see parabolas before? In section 2-8 we graphed parabolas by plotting points, because we were looking at parabolas as functions that could describe real world situations (ah, the dreaded word problem). Now, we will look at the same parabola in a slightly different way, as a Conic Section (circle, ellipse, hyperbola)
The definition Of course! We need the definition first! The set of all points in a plane equidistant from a point (focus) and a line (directrix).
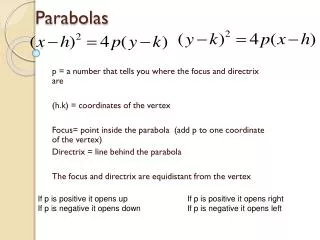
Parabola – “Up/Down” focus 4c Vertex: (h,k) c c directrix What if 4c < 0?
“Left/Right” Vertex: (h,k) 4c c c focus directrix What if 4c < 0?
FYI The book calls it “4p” instead – it’s the same thing. Other books have different versions of these equations, such as You can always convert it to a form you prefer. I prefer the one I’ve given you.
So what do we do with this? • Complete the square and get it in conic form (but only if there is a linear term for x and/or y). • Identify vertex and “c”. • Put focus, directrix, two points (width at focus) and AOS on the graph. Label these only. No tables or plotting 5 points this time.
Examples 4. Find the equation of the parabola with focus at (1, 5) and directrix at y = 9 Homework Change: pg 663 15, 17, 18, 20, 29, 30, 37, (graph the last 3)