Download
1 / 1
10 likes | 135 Views
Dissociation Constant D etermination by Fluorescence C ompetition Using Zinpyr-4. Rose Hadley , Roy Planalp rcv33@wildcats.unh.edu ; Parsons Hall, 23 Academic Way, Durham NH 03824. Introduction

E N D
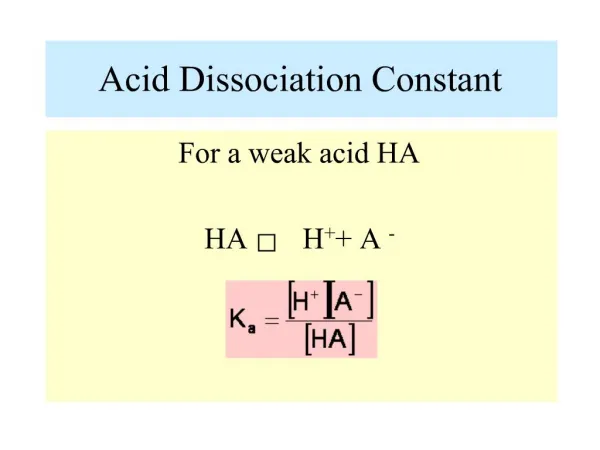
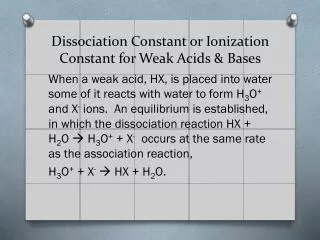
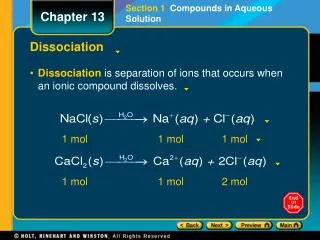
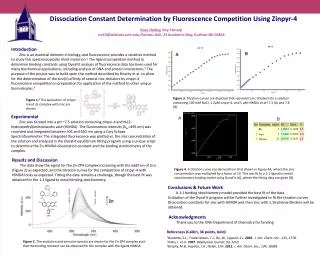
Dissociation Constant Determination by Fluorescence Competition Using Zinpyr-4 Rose Hadley, Roy Planalprcv33@wildcats.unh.edu; Parsons Hall, 23 Academic Way, Durham NH 03824 Introduction Zinc is an essential element in biology, and fluorescence provides a sensitive method to study this spectroscopicallysilent metal ion.1The ligand competition method to determine binding constants using DynaFit analysis of fluorescence data has been used for many biochemical applications, including analysis of DNA and protein interactions.2The purpose of the project was to build upon the method described by Brophy et al. to allow for the determination of the zinc(II) affinity of several zinc chelators by zinpyr-4 fluorescence competition in preparation for application of the method to other unique biomolecules.3 B A Figure 3. Titration curves are depicted that represent zinc titrated into a solution containing 100 mMNaCl, 1.2µM zinpyr-4, and 5 µM HIMDA at pH 7.3 (A) and 7.6 (B). Figure 1.1The speciation of zinpyr-4 and its complex with zinc are shown. Experimental Zinc was titrated into a pH ~7.5 solution containing zinpyr-4 and N-(2-hydroxyethyl)iminodiacetic acid (HIMDA). The fluorescence intensity (λex=495 nm) was recorded and integrated between 505 and 650 nm using a Cary Eclipse Spectrofluorimeter. The integrated fluorescence was plotted vs. the zinc concentration of the solution and analyzed in the DynaFit equilibrium fitting program using a unique script to determine the Zn-HIMDA dissociation constant and the binding stoichiometry of the complex. A B Results and Discussion The data show the signal for the Zn-ZP4 complex increasing with the addition of zinc (Figure 2) as expected ,and the titration curves for the competition of zinpyr-4 with HIMDA looks as expected. Fitting the data remains a challenge, though the best fit was obtained for the 1:1 ligand to metal binding stoichiometry. Figure 4. A titration curve eas derived from that shown in Figure 4A, where the zinc concentration was multiplied by a factor of 10. This was fit to a 1:1 ligand to metal stoichiometry binding model using DynaFit (A), where the fitting data are given (B). Conclusions & Future Work A 1:1 binding stoichiometry model provided the best fit of the data. Utilization of the DynaFit program will be further investigated to fit the titration curves. Dissociation constants for zinc with HIMDA and then zinc with 1,10-phenanthroline will be obtained. Acknowledgments Thank you to the UNH Department of Chemistry for funding. References (Calibri, 36 points, bold) 1Burdette, S.C., Frederickson, C.J., Bu, W., Lippard, S.J. 2003. J. Am. Chem. Soc., 125, 1778. 2Vitko, J. et al.2007. Biophysical Journal, 93, 3210. 3Brophy, M.B., Hayden, J.A., Nolan, E.M. 2012. J. Am. Chem. Soc., 134, 18089. Figure 2. The excitation and emission spectra are shown for the Zn-ZP4 complex such that the binding constant can be obtained for the complex with the ligand HIMDA.