
Uploaded by
tomas
0 SLIDES
145 VIEWS
0LIKES
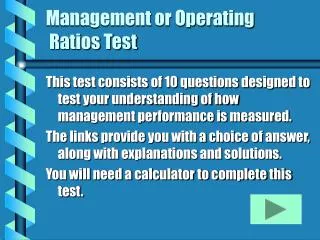
Introduction to Interactive Operating Ratios
DESCRIPTION
Nat Bartholomew, CPA Partner, CliftonLarsonAllen LLP. Introduction to Interactive Operating Ratios. This complimentary webinar is made possible with the support of Principal Financial Group®. Thank you to our sponsor!. www.asaebiz.org/retirement. 2. Our Presenter.
Download

1 / 0
Download Presentation 
Introduction to Interactive Operating Ratios
An Image/Link below is provided (as is) to download presentation
Download Policy: Content on the Website is provided to you AS IS for your information and personal use and may not be sold / licensed / shared on other websites without getting consent from its author.
Content is provided to you AS IS for your information and personal use only.
Download presentation by click this link.
While downloading, if for some reason you are not able to download a presentation, the publisher may have deleted the file from their server.
During download, if you can't get a presentation, the file might be deleted by the publisher.
E N D
Presentation Transcript
- Nat Bartholomew, CPAPartner, CliftonLarsonAllen LLP
Introduction toInteractive Operating Ratios
This complimentary webinar is made possible with the support of Principal Financial Group®. - Thank you to our sponsor! www.asaebiz.org/retirement 2
- Our Presenter Nat Bartholomew, CPAPartner, CliftonLarsonAllen LLP Email: nat.bartholomew@cliftonlarsonallen.comPhone: 703-825-2168 3
- Agenda Why benchmark (quick summary) Introduction to Association 990 General Product Overview Example Queries General Product Tour PDF Look-Up Building and Saving Reports Identifying Appropriate Metrics Example Metrics / Data – Making it Relevant Future of Association 990 4
- Why Benchmark? To compare like attributes or metrics from similar demographic data samples To uncover business processes, practices, and strategies To provide a baseline for performance improvement To gain best practices Measure by fact rather than intuition or opinion Benchmark when you want to … Make better-informed decisions Answer the question “how do I compare?” Take pulse of your financial health Obtain a single version of the truth 5
- ASAE Foundation’s “Association 990” Federal Form 990 – core form only 19,023 ’08, 19,578 ‘09 and 12,605 ‘10 990s thus far Functionality allows data sorts on the year and … 501(c) class (9 choices) Number of employees (6 tiers) Total revenue (8 tiers) and total expense (8 tiers) Membership revenue (8 tiers) Investment asset balance (8 tiers) Unrelated business income (7 tiers) Accounting method (accrual, cash or other) ASAE member (yes/no) State (52, includes DC and PR) Metropolitan area (36 different areas) 6
- ASAE Foundation’s “Association 990”Suite of Tools Association 990 - Key Ratios Predefined reports – key ratios, revenue and expense detail, and balance sheet detail Generated online Sort functionality enumerated on the prior slide Ability to export to Excel, Word or Adobe Association 990 - Agenda Items Drawn from the aggregate data, these slides (PDF and PPT) provide comparative data on policy, procedure and certain organizational measures 7
- Example Queries - Various 8
- Example Queries – Number of Employees 9
- Example Queries – Size (Revenue) 10
- Best “Average” Measure Median – ½ respondents above; ½ below Mean – sum of all cases / total # of respondents Median is a better measure for average when the upper limit is theoretically infinite (e.g., number of members in reporting associations, annual budget for reporting associations), as the mean can be strongly affected by very high values. 2010 # Employees (Mean = 32 / Median = 8) 2010 Total Revenue (Mean = $1.9M / Median = $487K) 11
- Compensation GeographicallyMedian / Mean (Total Revenue >/= $1M) 12
- Let’s Look Under the Hood 13
- Dues / Total Revenue = Dues Reliance 14 14
- 2010 Average Compensation Geographically
- 2010 Average Benefits by Size(based upon total revenue) 16
- 2010 Average Benefits (not including pension) by Size (based upon total revenue) 17
- Median Number of FTEs (Full-Time Employees) 18
- 2010 Revenue Growth(expressed as a percentage of revenue) 19
- Unrelated Business Income – 2008/09/10 20
- Unrelated Business Income – 2008/09/10 21
- 2010 Investments as a % of Total Assets 22
- Horizon Upgrades Contemplated Access to filed Federal Forms 990, similar to GuideStar Quartile results Association segments by industry/interest area (e.g., business/industrial, education, healthcare/medical, etc.) Ability to create comparison groups Drill-down functionality Slide generator Trend analyses functionality when multiple years of data are available Addition of Federal Form 990 Schedules to the database (e.g., Schedule J) 23
- Win Now: One Free Month of Association 990 Access. In the Q&A box, type your name and email address.Click the submit button. 24
- Association 990 Key Ratios Interactive Tool Pricing Options Annual (12-Month) Access: $650/members which includes complementary edition of ASAE’s 2012 Operating Ratio Report and $900/nonmembers One-Month Access: $325/members and $450/nonmembers To order from the ASAE Bookstore, click on the Resources Box **Earn a 10 percent discount off of the Annual Access price by making sure your organization participates in the 2012 Operating Ratio Report survey. Deadline is March 15. For details: contact Haisong Peng at hpeng@asaecenter.org or 202-626-2820.** 25
- Questions & Answers ? 26
- Thanks for joining us! To order from the ASAE Bookstore,click on the Resources Box.


More Related