Download
1 / 28
280 likes | 451 Views
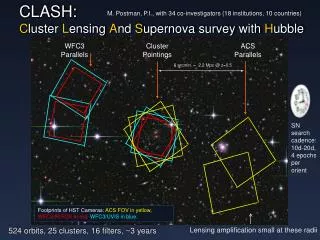
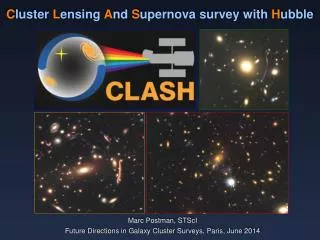
C luster L ensing A nd S upernova survey with H ubble. Marc Postman, STScI Science with HST IV – Rome – March 19, 2014. The CLASH Science Team: ~60 researchers, 30 institutions, 12 countries. CLASH Team at RAS, London, Sept 2013.

E N D
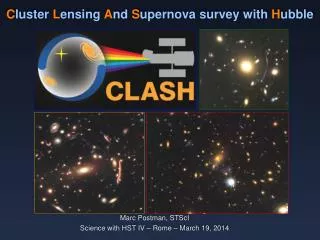
Cluster Lensing And Supernova survey with Hubble Marc Postman, STScI Science with HST IV – Rome – March 19, 2014
The CLASH Science Team: ~60 researchers, 30 institutions, 12 countries CLASH Team at RAS, London, Sept 2013 • A HST Multi-Cycle Treasury Program designed to place new constraints on the fundamental components of the cosmos: dark matter, dark energy, and baryons. • To accomplish this, we are using galaxy clusters as cosmic lenses to probe dark matter and magnify distant galaxies. • Multiple observation epochs enable a z > 1 SN search in the surrounding field (where lensing magnification is low).
Fundamental Questions That We Aim To Answer 130 Mpc • How is dark matter distributed in cluster & galaxy halos? • How centrally concentrated is the DM? Implications for epoch of formation. • What degree of substructure exists? And on what scales? • How well do DM profiles match those predicted from simulations? • What correlations exist between the distribution of baryonic matter and DM? 12.5 Gyr “Millennium” simulation of DM Springel et al. 2005
Fundamental Questions That We Aim To Answer • When was the epoch of first galaxy formation? • What are the characteristics (mass, chemical abundance, star formation rate, global structure) of the most distant galaxies in the universe (tU < 800 Myr)? • What was their role in ionizing the intergalactic medium? • How do galaxies build up and evolve at the earliest times? Simulating the First Galaxies Safranek et al. 2013
Fundamental Questions That We Aim To Answer w = P / ρc2 w = -1 (cosmoconstant) w ≠ constant; scalar field e.g. Quintessence, k-essence Is w a f(z)? w(z) = wo + waz/(1+z) (e.g., Linder 2003) • Why is the expansion of the universe accelerating? • Is it something other than Λ? • What are the parameters of the dark energy equation of state? • What is the rate of high-z type Ia supernovae? What does the rate tell us about their progenitors? • How standard are our “standard” candles (cosmic distance indicators)? Need better measurements of systematic effects at large lookback times. w 1 + z
Comprehensive Multi-wavelength Coverage • HST 524 orbits: 25 clusters, each imaged in 16 passbands. (0.23 – 1.6 μm) ~20 orbits per cluster. HST survey complete. • Subaru wide-field imaging (0.4 – 0.9 μm) • Chandra x-ray Observatory archival data (0.5 – 7 keV) and XMM data. • Spitzer Space Telescope archival and new cycle 8 data (3.6, 4.5 μm) • SZE observations (Bolocam, Mustang) to augment existing data (sub-mm) • VLT, LBT, Magellan, MMT, Palomar Spectroscopy (~30,000 spectra to date) Co-added images and source catalogs publicly available via the MAST website. Mass models, Subaru images, and spectra are also being made available.
130 kpc Abell 611 (z = 0.288) 30 arc-seconds
The Power of WFC3-IR Camera CL J1226+3332 (z=0.89) Sum of all WFC3-IR data Sum of all ACS data Flux Fν (μJy) Photo-z Prob. Cluster redshift Discovery of a giant arc with photo-z ~ 1.95
The CLASH (HST) Gallery A1423 (0.214) A383 (0.189) A209 (0.209) A2261 (0.224) RXJ2129 (0.234) A611 (0.288) MS2137 (0.315) MACS1931 (0.352) MACS1115 (0.353) RXJ1532 (0.363) MACS1720 (0.391) RXJ2248 (0.348) MACS0416 (0.396) MACS0429 (0.399) MACS1206 (0.440) MACS0329 (0.450) RXJ1347 (0.451) MACS1311 (0.494) CLJ1226 (0.890) MACS1149 (0.544) MACS1423 (0.545) MACS0717 (0.548) MACS2129 (0.570) MACS0647 (0.591) MACS0744 (0.686) 20 clusters are x-ray selected (Tx > 5 kev, low asymmetry), 5 clusters are very strong lenses (Einstein radii > 30 arcsec) .
Photo-z Accuracy: 16 filters pay off! Galaxies in or near the clusters Galaxies beyond the clusters Jouvel et al. 2013 1 2 3 4 5 6 Most outliers due to contamination from an adjacent galaxy’s light. When fixed, we reach an accuracy of ~0.03 (1 + z). Can do about 2x – 3x better when we apply more sophisticated sky subtraction. But 3% is good enough for most of our science. The majority of the CLASH spectroscopic data comes from our VLT Large Program.
Pre-CLASH: Well constrained cluster mass profiles (from lensing) were more concentrated than simulated clusters c-M relation is a direct test of CDM paradigm as it predicts a strong correlation between the two. Observational studies of clusters with well constrained mass profiles yielded concentrations that were in tension with predictions. Partially explained by significant (50-100%) lensing selection bias as estimated by Hennawi07, Oguri09, Meneghetti10,11 – Broadhurst08, Oguri09, Sereno10, Zitrin11a,b Umetsu11 Oguri09 50% lensing bias? A predictive theory of the c-M relation does not exist …
Possible explanations for high observed concentrations • Lensing selection bias (Henawi+07, Oguri+09, Meneghetti+10,11) • Significant (25-50%) but is it sufficient? • 20 CLASH clusters are x-ray selected (minimal lensing bias) • Baryons and adiabatic contraction • Probably not a major (<10%) effect in clusters (Duffy+10, Mead+10, Fedeli11) … but needs to be checked. • Halo fitting procedure in simulations • Hennawi+07 find ~30%+ higher concentrations • Halo Triaxiality and LSS • Clusters formed sooner than in simulations • Early Dark Energy (Fedeli & Bartelmann07, Sadeh & Rephaeli08, Francis+09, Grossi & Springel09) • Few percent EDE at z~10 has impact.
Convergence Maps for CLASH Clusters: SL+WL data • Full 2D Mass Reconstructions: • All CLASH clusters are analyzed with uniform data quality and reconstruction parameters. Each mass model set consists of 2,000 bootstrap re-samplings for error analysis. Merten et al. 2014, in prep
CLASH WL Masses Agree With WL Masses from the “Weighing The Giants” Project
Dynamical analysis (Biviano et al. 2013) MACS1206 (z=0.45) Total mass profile from completely independent methods WL convergence Constraints from Weak Lensing Constraints from Strong Lensing Stay tuned for Claudio Grillo’s Talk (Umetsu et al. 2012)
Dark Matter Equation of State Parameter, w(r): where pr(r) and pt(r) are the radial and tangential DM pressure profiles and ρ(r) is the density. Since baryons contribute at most 15% to the total mass in clusters and their pressure is negligible, the EoS parameter we derive describes the behavior of the DM fluid. The result here is currently the most stringent constraint on the DM EoS parameter. DM in clusters is indeed consistent with a pressureless fluid. Radially averaged value: w = 0.00 ± 0.15 (stat) ± 0.08 (syst) Sartoris et al. 2014 Above: The constraints on the EoS parameter, w(r), using different assumptions about the total mass and orbital velocity distributions.
CLASH Mass-Concentration Relation Simulations (Meneghetti+14): Multi-DARK N-body sims + gas physics + X-ray Selection Ratio of Data to Model Conc. 0.96 ± 0.18 (p=0.80) Tension between previous data and predictions largely a sample selection effect. CLASH M-c relation is fully consistent with LCDM. Merten et al. 2014 (in prep)
CLASH Lensing So Far … • CLASH discovering up to 10x as many multiple images as previously known, even in well studied systems. All with reliable photo-z. Enables precise SL mass profile shape measurements. • Excellent consistency between WL and SL mass profiles in range where they overlap. Dynamical analyses also provide consistent mass profiles (can constrain DM EoS– no significant pressure term). • CLASH finds that x-ray selected clusters have Mass-concentration relation that is consistent with predictions from LCDM N-body simulations. No tension remains between the data and the predictions at the high mass end. • Furthermore – we resolve the “giant arc statistics” problem. Data and predictions differ by < 3 sigma.
CLASH: Magnified High-z Galaxies • Steep LFs largely mitigate the decreased intrinsic source-plane area • Higher spectral and spatial resolution than typical LBG surveys • Detection of sources fainter than possible in most high-z surveys CLASH finds a large number of high-redshift galaxies Largest sample of lensed star-forming galaxies at z >~ 5.5 to date 7 multiply-imaged systems at z >~ 5.5 Bradley et al. (2014)
CLASH: Magnified High-z Galaxies HUDF12 Limit Bradley et al. (2014) Median magnifications: μ ~ 4.2, 4.2, 4.5 for z ~ 6, 7, 8 samples Instrinsic (unlensed) magnitudes nearly reach 34 mag Caveat: largest magnifications have large uncertainties! For subset of data analyzed with Spitzer photometry: stellar ages imply formation epochs between 9 < z < 25
Two z > 9 Lensed Galaxies z = 9.6 object in MACSJ1149+2223 z = 10.8 object in MACSJ0647+7015 Coe et al. 2013, ApJ, 762, 32 Dan Coe will discuss further Zheng et al. 2012, Nature, 489, 406
Using CLASH Lensed Galaxies to Constrain Dark Matter Properties • Finding structures in the early universe can place a constrain the mass of the warm dark matter particle, if it exists. • WDM is a relativistic particle whose mass is expected to be inversely proportional to its free streaming length. • WDM tends to smooth out structure. Hence, if one sees structure at a given scale at early epochs then it suggests the free streaming length of WDM must be SMALLER than such structure. Hence, providing an LOWER limit to the mass of the WDM particle. • Too much structure found on small scales can rule out WDM altogether.
Independent constraint on the nature of DM • WDM particle mass mX > 1.0 (0.9) keV at 68% (95%) • Limit depends only on WDM halo mass function, not on astrophysical modeling. Pacucci+13: “Even a few galaxies found in such small volumes require a very high number density of collapsed dark matter (DM) haloes. This implies significant primordial power on small scales, allowing these observations to rule out popular alternatives to standard cold dark matter (CDM) models, such as warm dark matter (WDM).” (too much small scale power) CLASH 2013 Pacucci et al. 2013, MNRAS, 435, 53.
CLASH High-z Galaxy Summary • We have found hundreds of lensed LBGs at high-redshift. Numbers consistent with extrapolatons. • We have discovered at least two candidate z > 9 dwarf galaxies. H-mag = 25.7 – 25.9; 8x - 15x brighter than if in unlensed field. • Lensing provides most detailed look at structure of z > 6 galaxies. Often reach 100 – 200 pc resolution at these redshifts. • Detection of even two z~10 galaxies provided a new lower limit on WDM particle mass. • Still to come: constraints on UV slope and galaxy contribution to re-ionization of universe.
39 CLASH SNe Discovered Over 3 years. (27 in parallel fields, 12 in prime fields). The 27 SNe discovered in the parallel fields are shown here. Each triple image set here shows the template image, the discovery image, and the difference image (SN image – template image) ~48% of the SNe are classified as Type Ia. At least 7 (18%) of the 39 SNe are at z > 1. Date of maximum light can occur up to 40 days before and 20 days after the duration of the survey for each cluster Graur et al. 2014
SN Geta (RXJ2129+0005) Type Ia at z = 1.64 CMD plot 30 days pre-maximum (observer frame) F160W F125W 56100 56120 56140 56160 56180 56200 56220 56240 obs frame time (MJD) F160W F350LP – F125W F350LP – F160W F125W Type Ia (red) Type Ib/c (green) Type II (blue) PubliusSeptimiusGeta (189 – 211 AD, Rome) Template Discovery Difference
Constraining the Delay Time Distribution(the distribution of times that elapse between a short burst of star formation and the subsequent SN Ia explosions) = CLASH = CANDELS Curves are DTD convolved with SF history The combined SN Ia Rates favor Double Degenerate Progenitor Models (DTD ~ t-1) Measured exponent: 1.00 ± 0.06 (stat) ± ~0.10 (sys)
Overall CLASH Summary • Survey revealing many new and exciting discoveries. • Joint SL+WL yield precise measurements of mass & concentrations. X-ray selection important for unbiased tests of LCDM. • Providing our first look at “JWST’s Universe” – the epoch when the Universe was < 500 Myr old. (Dan Coe’s talk) • SN Ia survey reveals low rates at z > 1, suggesting low fraction of prompt (delay time <500 Myr) SNe. Rate data currently disfavors single degenerate progenitor scenario at z > 1. • Enables new independent constraints on WDM particle mass and DM EoS (pressureless DM is consistent with observations). • Providing superb mass calibrators for larger cluster surveys: WL + SL + X-ray + SZE + Dynamics • To date: 45+ refereed papers. Zitrin et al. 2010 z = 4.92 Galaxy ACS PSF Future: HST/FFI, Euclid, WFIRST, JWST, NIR MOS, ATLAST 0.2” How object would look without cluster lensing