Download
1 / 13
130 likes | 288 Views
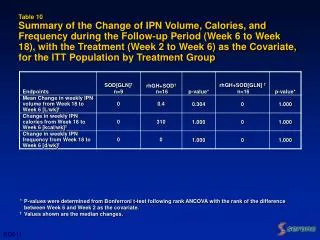
Table 10 Summary of the Change of IPN Volume, Calories, and Frequency during the Follow-up Period (Week 6 to Week 18), with the Treatment (Week 2 to Week 6) as the Covariate, for the ITT Population by Treatment Group.

E N D
Table 10Summary of the Change of IPN Volume, Calories, and Frequency during the Follow-up Period (Week 6 to Week 18), with the Treatment (Week 2 to Week 6) as the Covariate, for the ITT Population by Treatment Group *P-values were determined from Bonferroni t-test following rank ANCOVA with the rank of the difference between Week 6 and Week 2 as the covariate. † Values shown are the median changes. BD011
Weaning Criteria 1:Ability to Hydrate positive enteral balance(enteral fluid intake [mL] - volume of stool output [mL]) ~ 500 mL/d and/or urine volume 0.5 mL/kg/h over 24 h or ~ 75% of calculated minimum urine volumeprior to nighttime infusion EF167
Weaning Criteria 2:Maintaining Normal Electrolytes Serum Sodium 135 - 146 mEq/L Serum Potassium 3.5 - 4.7 mEq/L Serum Bicarbonate 19 - 25 mEq/L EF168
Weaning Criteria 3:Ability to Sustain an Appropriate Body Weight Maintenance of total body water (relatively stable BIA) or An ability to gain body weight while maintainingtotal body water (relatively stable BIA) and An ability to consistently consume orally 80% to 100%of estimated total caloric requirements(corrected for malabsorption)as calculated from standard equations EF169
IMP20317 (Final) (1 of 2)_CC1Components of the Key Efficacy Endpoint Total IPN Volume (L/week) – ITT Population EF208
IMP20317 (Final) (2 of 2)_CC2Components of the Key Efficacy Endpoint Total IPN Volume (L/week) – ITT Population EF209
FDA minutes of August 22, 2000 meeting (teleconference) “The Division advised the sponsor that there is no statistical requirement concerning a minimum number of patients per center. If they are able to find another site that can enroll fewer patients than the sponsor's current goal of 10 patients per center, the issue of statistical analysis can be worked through by modeling, combining center, etc.” EF146
July 2001– FDA teleconference (Excerpt from Sponsor record) S. Malozowski summarized the discussion by saying that reaching a p-value of 0.05 based on data from two centers would likely be considered a “win” by the Agency while submission of a file based on data from a single center would involve some level of risk. EF147
Body Weight (kg): Week 0 vs. Week 18 P = ns for rhGH + SOD vs. SOD (GLN) and for rhGH = SOD (GLN) vs. SOD (GLN) EF173
Table 3.4.16 (1 of 2)Summary of Weight (kg) by Week(Safety Population) SAF064
Table 3.4.16 (2 of 2)Summary of Weight (kg) by Week(Safety Population) Listings of Vital Signs Data - Values and Change from Baseline in Appendix 16.2.8.4 and Body Weight - Values and Change from Baseline in Appendix 16.2.8.5. SAF065
Diet Parameter:Resistance (BIA, average ohms/day) 1 P-value is from Dunnett’s t-test EF219
Table 2.1.1Summary of Hydration Fluid Intake (mL)Per Week over Time (ITT Population) – All Sites Listing of Derived Hydration Fluid, Urine Output, and Stool Output by Week in Appendix 16.2.6.11 EF017