Download
1 / 9
90 likes | 164 Views
Analyze lattice constants in Si, Ge, and SiGe layers from TEM image using FFT and Hann filtering. Calculate strain and rotation at each point.

E N D
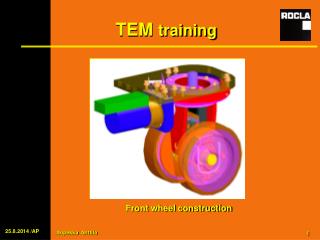
TEM Lattice Calculator Documentation Jamie Teherani 5/16/2013
Scale 30.23 pixels/nm Example Input • File oxide_sSi_sGe_SiGe.png: high resolution TEM image of an epitaxially grown heterostructure of Si, Ge, and SiGe • The SiGe is relaxed meaning that it has zero strain in all 3 lattice directions • The Si and Ge layers are strained to the lattice constant of SiGe in the - and - direction, but not in the -direction since it is a free surface. Oxide Strained-Si Strained-Ge Relaxed Si0.7Ge0.3
Strain and Lattice Constants • Lattice constants, nm, nm, nm • Since the SiGe layer has a smaller lattice constant than Ge, the Ge is biaxially compressively strained in the - plane. This strain results in tensile strain in the -direction due to Poisson’s ratio. • Since the SiGe layer has a larger lattice constant than Si, the Si is biaxiallytensiley strained in the - plane. This strain results in compressive strain in the -direction due to Poisson’s ratio. Lattice constants from http://www.ioffe.rssi.ru/SVA/NSM/Semicond/
The sample image is uploaded. Input the scale and approximate lattice constant. The program uses the approximate lattice constant as a starting point to find the actual lattice constant.
The -direction in the image represents the Miller direction. The -direction in the image represents the Miller direction.
Outputs • Hann Filtered TEM: the original image with a Hann filter applied to it. The Hann filter is a sinusoidal function that decays to 0 at the edges of the image to reduce noise in the FFT. • ABS(FFT(TEM)): the absolute value of the 2D Fourier transform of the Hann Filtered TEM. The blue boxes represent the areas over which the program searches for a maximum. The location of the maximum is related to the lattice constant. Zooming in reveals a red + and blue and green circles. The red + indicates the location of the approximate lattice constant entered in the input. The green and blue circles indicate the location of the actual maxima.
Outputs • Lattice Constant in x-direction, ax: the lattice constant in the x-direction as a function of position in the image. The lattice constant in the x-direction is maintained in all the layers except the oxide, which is amorphous. Across the image, the average ax is ~0.565 nm which is quite large. This suggests that input value of image scale in pixels/nm should be adjusted to a slightly larger value such that . • Lattice Constant in y-direction, ay: the -directed lattice constant is seen to vary substantially across the layers due to the strain.
Outputs • Clockwise Rotation at Each Scan Point: the calculate rotation as a function of position. The rotation is calculated from the maxima of the FFT of the image at each point of the scan. • Sampled Portion of Original TEM: the portion of the original TEM image over which the scan was performed. It can be useful in creating an overlay.