Download
1 / 34
340 likes | 459 Views
Naïve Bayes Classification. CS 6243 Machine Learning Modified from the slides by Dr. Raymond J. Mooney http://www.cs.utexas.edu/~mooney/cs391L/. Probability Basics. Definition (informal)

E N D
Naïve Bayes Classification CS 6243 Machine Learning Modified from the slides by Dr. Raymond J. Mooney http://www.cs.utexas.edu/~mooney/cs391L/
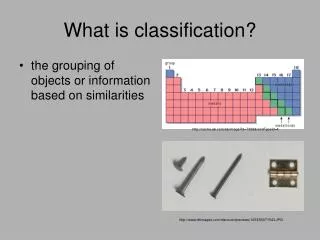
Probability Basics • Definition (informal) • Probabilities are numbers assigned to events that indicate “how likely” it is that the event will occur when a random experiment is performed • A probability law for a random experiment is a rule that assigns probabilities to the events in the experiment • The sample space S of a random experiment is the set of all possible outcomes
Probabilistic Calculus • All probabilities between 0 and 1 • If A, B are mutually exclusive: • P(A B) = P(A) + P(B) • Thus: P(not(A)) = P(Ac) = 1 – P(A) S B A
Conditional probability • The joint probability of two events A and B P(AB), or simply P(A, B) is the probability that event A and B occur at the same time. • The conditional probability of P(A|B) is the probability that A occurs given B occurred. P(A | B) = P(A B) / P(B) <=> P(A B) = P(A | B) P(B) <=> P(A B) = P(B|A) P(A)
Example • Roll a die • If I tell you the number is less than 4 • What is the probability of an even number? • P(d = even | d < 4) = P(d = even d < 4) / P(d < 4) • P(d = 2) / P(d = 1, 2, or 3) = (1/6) / (3/6) = 1/3
Independence • A and B are independent iff: • Therefore, if A and B are independent: These two constraints are logically equivalent
Examples • Are P(d = even) and P(d < 4) independent? • P(d = even and d < 4) = 1/6 • P(d = even) = ½ • P(d < 4) = ½ • ½ * ½ > 1/6 • If your die actually has 8 faces, will P(d = even) and P(d < 5) be independent? • Are P(even in first roll) and P(even in second roll) independent? • Playing card, are the suit and rank independent?
Theorem of total probability • Let B1, B2, …, BN be mutually exclusive events whose union equals the sample space S. We refer to these sets as a partition of S. • An event A can be represented as: • Since B1, B2, …, BN are mutually exclusive, then • P(A) = P(A B1) + P(A B2) + … + P(ABN) • And therefore • P(A) = P(A|B1)*P(B1) + P(A|B2)*P(B2) + … + P(A|BN)*P(BN) • = i P(A | Bi) * P(Bi) Marginalization Exhaustive conditionalization
Example • A loaded die: • P(6) = 0.5 • P(1) = … = P(5) = 0.1 • Prob of even number? P(even) = P(even | d < 6) * P (d<6) + P(even | d = 6) * P (d=6) = 2/5 * 0.5 + 1 * 0.5 = 0.7
Another example • A box of dice: • 99% fair • 1% loaded • P(6) = 0.5. • P(1) = … = P(5) = 0.1 • Randomly pick a die and roll, P(6)? • P(6) = P(6 | F) * P(F) + P(6 | L) * P(L) • 1/6 * 0.99 + 0.5 * 0.01 = 0.17
Bayes theorem • P(A B) = P(B) * P(A | B) = P(A) * P(B | A) Conditional probability (likelihood) P ( A | B ) P ( B ) Prior of B => = P ( B | A ) P ( A ) Posterior probability Prior of A (Normalizing constant) This is known as Bayes Theorem or Bayes Rule, and is (one of) the most useful relations in probability and statistics Bayes Theorem is definitely the fundamental relation in Statistical Pattern Recognition
Bayes theorem (cont’d) • Given B1, B2, …, BN, a partition of the sample space S. Suppose that event A occurs; what is the probability of event Bj? • P(Bj | A) = P(A | Bj) * P(Bj) / P(A) = P(A | Bj) * P(Bj) / jP(A | Bj)*P(Bj) Posterior probability Prior of Bj Likelihood Normalizing constant (theorem of total probabilities) Bj: different models / hypotheses In the observation of A, should you choose a model that maximizes P(Bj | A) or P(A | Bj)? Depending on how much you know about Bj !
Example • A test for a rare disease claims that it will report positive for 99.5% of people with disease, and negative 99.9% of time for those without. • The disease is present in the population at 1 in 100,000 • What is P(disease | positive test)? • P(D|+) = P(+|D)P(D)/P(+) = 0.01 • What is P(disease | negative test)? • P(D|-) = P(-|D)P(D)/P(-) = 5e-8
Joint Distribution • The joint probability distribution for a set of random variables, X1,…,Xn gives the probability of every combination of values (an n-dimensional array with vn values if all variables are discrete with v values, all vn values must sum to 1): P(X1,…,Xn) • The probability of all possible conjunctions (assignments of values to some subset of variables) can be calculated by summing the appropriate subset of values from the joint distribution. • Therefore, all conditional probabilities can also be calculated. negative positive
Probabilistic Classification • LetY be the random variable for the class which takes values {y1,y2,…ym}. • Let X be the random variable describing an instance consisting of a vector of values for n features <X1,X2…Xn>, let xk be a possible value for X and xij a possible value for Xi. • For classification, we need to compute P(Y=yi | X=xk) for i=1…m • However, given no other assumptions, this requires a table giving the probability of each category for each possible instance in the instance space, which is impossible to accurately estimate from a reasonably-sized training set. • Assuming Y and all Xi are binary, we need 2nentries to specify P(Y=pos | X=xk) for each of the 2n possible xk’ssinceP(Y=neg | X=xk) = 1 – P(Y=pos | X=xk) • Compared to 2n+1 – 1 entries for the joint distribution P(Y,X1,X2…Xn)
Bayesian Categorization • Determine category of xk by determining for each yi • P(X=xk) can be determined since categories are complete and disjoint.
Bayesian Categorization (cont.) • Need to know: • Priors: P(Y=yi) • Conditionals: P(X=xk | Y=yi) • P(Y=yi) are easily estimated from data. • If ni of the examples in D are in yi then P(Y=yi) = ni / |D| • Too many possible instances (e.g. 2n for binary features) to estimate all P(X=xk | Y=yi). • Need to make some sort of independence assumptions about the features to make learning tractable.
Conditional independence • Chain rule: P(x1, x2, x3) = P(x1, x2, x3) / P(x2, x3) * P(x2, x3) / P(x3) * P(x3) = P(x1 | x2, x3) P(x2 | x3) P(x3) • P(x1, x2, x3 | Y) = P(x1 | x2, x3, Y) P(x2 | x3 , Y) P(x3 | Y) = P(x1 | Y) P(x2 | Y) P(x3 , Y) assuming conditional independence
Size Color Shape Naïve Bayes Generative Model neg pos pos neg pos neg pos Category lg circ circ red red med blue tri sm blue sqr sm tri med lg grn tri circ circ grn red med grn red med circ tri circ lg blue sqr circ lg lg sm red sm blue sqr red lg med circ grn sm sm tri sqr blue red Size Color Shape Negative Positive
?? ?? Size Color Shape Naïve Bayes Inference Problem lg red circ neg pos pos neg pos neg pos Category lg circ circ red red med blue tri sm blue sqr sm tri med lg grn tri circ circ grn red med grn red med circ tri circ lg blue sqr circ lg lg sm red sm blue sqr red lg med circ grn sm sm tri sqr blue red Size Color Shape Negative Positive
Naïve Bayesian Categorization • If we assume features of an instance are independent given the category (conditionally independent). • Therefore, we then only need to know P(Xi | Y) for each possible pair of a feature-value and a category. • If Y and all Xi and binary, this requires specifying only 2n parameters: • P(Xi=true | Y=true) and P(Xi=true | Y=false) for each Xi • P(Xi=false | Y) = 1 – P(Xi=true | Y) • Compared to specifying 2n parameters without any independence assumptions.
Naïve Bayes Example Test Instance: <medium ,red, circle>
Naïve Bayes Example Test Instance: <medium ,red, circle> P(positive | X) = P(positive)*P(medium | positive)*P(red | positive)*P(circle | positive) / P(X) 0.5 * 0.1 * 0.9 * 0.9 = 0.0405 / P(X) = 0.0405 / 0.0495 = 0.8181 P(negative | X) = P(negative)*P(medium | negative)*P(red | negative)*P(circle | negative) / P(X) 0.5 * 0.2 * 0.3 * 0.3 = 0.009 / P(X) = 0.009 / 0.0495 = 0.1818 P(positive | X) + P(negative | X) = 0.0405 / P(X) + 0.009 / P(X) = 1 P(X) = (0.0405 + 0.009) = 0.0495
Estimating Probabilities • Normally, probabilities are estimated based on observed frequencies in the training data. • If D contains nkexamples in category yk, and nijk of these nk examples have the jth value for feature Xi, xij, then: • However, estimating such probabilities from small training sets is error-prone. • If due only to chance, a rare feature, Xi, is always false in the training data, yk :P(Xi=true | Y=yk) = 0. • If Xi=true then occurs in a test example, X, the result is that yk: P(X | Y=yk) = 0 and yk: P(Y=yk | X) = 0
Test Instance X: <medium, red, circle> P(positive | X) = 0.5 * 0.0 * 1.0 * 1.0 / P(X) = 0 P(negative | X) = 0.5 * 0.0 * 0.5 * 0.5 / P(X) = 0 Probability Estimation Example
Smoothing • To account for estimation from small samples, probability estimates are adjusted or smoothed. • Laplace smoothing using an m-estimate assumes that each feature is given a prior probability, p, that is assumed to have been previously observed in a “virtual” sample of size m. • For binary features, p is simply assumed to be 0.5.
Laplace Smothing Example • Assume training set contains 10 positive examples: • 4: small • 0: medium • 6: large • Estimate parameters as follows (if m=1, p=1/3) • P(small | positive) = (4 + 1/3) / (10 + 1) = 0.394 • P(medium | positive) = (0 + 1/3) / (10 + 1) = 0.03 • P(large | positive) = (6 + 1/3) / (10 + 1) = 0.576 • P(small or medium or large | positive) = 1.0
Missing values • Training: instance is not included in frequency count for attribute value-class combination • Classification: attribute will be omitted from calculation • Example: witten&eibe
Continuous Attributes • If Xi is a continuous feature rather than a discrete one, need another way to calculate P(Xi | Y). • Assume that Xi has a Gaussian distribution whose mean and variance depends on Y. • During training, for each combination of a continuous feature Xi and a class value for Y, yk, estimate a mean, μik , and standard deviation σik based on the values of feature Xi in class yk in the training data. • During testing, estimate P(Xi | Y=yk) for a given example, using the Gaussian distribution defined by μik and σik .
Statistics forweather data • Example density value: witten&eibe
Classifying a new day • A new day: • Missing values during training are not included in calculation of mean and standard deviation witten&eibe
*Probability densities • Relationship between probability and density: • But: this doesn’t change calculation of a posteriori probabilities because cancels out • Exact relationship: witten&eibe
Naïve Bayes: discussion • Naïve Bayes works surprisingly well (even if independence assumption is clearly violated) • Experiments show it to be quite competitive with other classification methods on standard UCI datasets. • Why? Because classification doesn’t require accurate probability estimates as long as maximum probability is assigned to correct class • However: adding too many redundant attributes will cause problems (e.g. identical attributes) • Note also: many numeric attributes are not normally distributed ( kernel density estimators) • Does not perform any search of the hypothesis space. Directly constructs a hypothesis from parameter estimates that are easily calculated from the training data. • Typically handles noise well since it does not even focus on completely fitting the training data. witten&eibe
Naïve Bayes Extensions • Improvements: • select best attributes (e.g. with greedy search) • often works as well or better with just a fraction of all attributes • Bayesian Networks witten&eibe