Download
1 / 70
790 likes | 1.01k Views
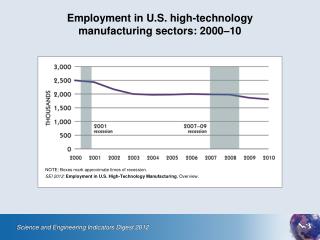
The Surprisingly Swift Decline of U.S. Manufacturing Employment. Justin R. Pierce Board of Governors of the Federal Reserve System Peter K. Schott Yale School of Management & NBER. Disclaimer

E N D
The Surprisingly Swift Decline of U.S. Manufacturing Employment Justin R. Pierce Board of Governors of the Federal Reserve System Peter K. Schott Yale School of Management & NBER
Disclaimer Any opinions and conclusions expressed herein are those of the authors and do not necessarily represent the views of the U.S. Census Bureau, the Board of Governors or its research staff. All results have been reviewed to ensure that no confidential information is disclosed.
Post-War U.S. Manufacturing Employment -2.9 mill over 3 years
Post-War U.S. Manufacturing Employment -2.9 mill over 3 years
Introduction • The sharp decline in US manufacturing employment since 2001 is closely linked to a change in US trade policy: • China’s receipt of Permanent Normal Trade Relations in late 2000 • PNTR did not change actual tariff rates: Chinese imports were already eligible for low NTR rates typically reserved for WTO members • But for China, NTR required contentious annual renewals • Failure would increase tariffs to Smoot-Hawley levels • The potential for large tariff increases likely discouraged: • US firms from openings plants in China • Chinese firms from making investments to export to US • With PNTR, the possibility of future tariff hikes was eliminated
Before Continuing… …note that manufacturing real value added continues to rise at the historical pace
Outline • US-China Trade Policy • Data • Baseline results • Alternate explanations • Additional results • Conclusion
US NTR and Non-NTR Tariffs • NTR = Normal Trade Relations • Synonym for Most Favored Nation (MFN) • The US has two basic tariff schedules • NTR tariffs : for WTO members; generally low • Non-NTR tariffs : for non-market economies; generally high; set by Smoot-Hawley (1930) • So how does China fit into these categories?
US-China Trade Policy, 1980-2001 2001 (December) China enters WTO Annual renewals of MFN status were uncertain 1980 (February) China was granted temporary NTR status by the US Congress Temporary NTR requires annual re-approval by Congress 2000 (October) U.S. Congress grants China PNTR, eliminating the risk that a failed vote might lead to a jump in tariffs
Measuring the Policy Change • Measure the effect of the policy as: • NTR Gap = Non-NTR Tariff – NTR Tariff • Measures extent to which tariffs could increase prior to PNTR • Varies across industries • We can preview the results in two simple figures that use public data
Preview of Findings – EmploymentPublic NBER-CES Data • High- and low-gap industries follow roughly parallel trends in two decades prior to PNTR
Preview of Findings – EmploymentPublic NBER-CES Data • High- and low-gap industries follow roughly parallel trends in two decades prior to PNTR • After PNTR the series diverge with employment falling most sharply in the high-gap industries most affected by PNTR • (Note: we use the gap as a continuous variable in our regression analysis.)
Preview of Findings – TradePublic Census Trade Data • Divergence is also evident in trade data
Preview of Findings – TradePublic Census Trade Data • Divergence is also evident in trade data • Imports from China in the more-exposed products jump after PNTR
Preview of Findings – TradePublic Census Trade Data • Divergence is also evident in trade data • Imports from China in the more-exposed products jump after PNTR • This trend is not present in imports from rest-of-world (ROW)
Preview of Findings – TradePublic Census Trade Data • Divergence is also evident in trade data • Imports from China in the more-exposed products jump after PNTR • This trend is not present in imports from rest-of-world (ROW) • Find similar results for number of U.S. importers, Chinese exporters and importer-exporter pairs
Related Research • Employment and trade liberalization • Lots of papers • Autor et al. (2012); Bloom et al. (2012) • Investment under uncertainty • Lots of papers • Trade: Handley (2012); Handley and Limao (2012, 2013) • “Jobless” recoveries • Manufacturing: Faberman (2012) • Overall: Jaimovich and Siu (2012) • Supply-chain linkages • US manufacturing: Ellison, Glaeser and Kerr (2010) • Trade: Baldwin and Venables (2012)
Outline • US-China Trade Policy • Data • Baseline results • Alternate explanations • Additional results • Conclusion
NTR Gaps • NTR Gap = Non-NTR Tariff – NTR Tariff • Compute for each HS8 product using the ad valorem equivalent NTR and non-NTR rates from Feenstra, Romalis and Schott (2003) available for 1989-2001 • The NTR Gap for industry i is the mean over the gaps of the HS8s in that industry
Distribution of 1999 NTR Gap • The gap is large in economic terms • Varies substantially across industries, allowing for identification of effect of PNTR • 89 percent of the variation in the NTR gap across industries arises from variation in non-NTR rates, set in 1930 Mean: 0.32 Std: 0.15
Census Data • LBDxxxxxxxxxxxxxxxxxxxx • CMxxxxxxxxxxxxxxxxxxxxx • LFTTD • Annual employment of all U.S. establishments, 1977-2009 • Employment + other attributes for all manufacturing establishments every five years, 1977(5)2007 • Transaction-level US import data: value, importer ID, foreign exporter ID
Outline • US-China Trade Policy • Data • Baseline results • Alternate explanations • Additional results • Conclusion
Empirical Strategy • We use a difference-in-differences strategy to examine the link between PNTR/WTO and U.S. manufacturing employment outcomes • 1st difference: industries with higher vs lower NTR Gaps • 2nd difference: outcomes after 2001 vs before • PNTR coincides with the 2001 peak, so compare employment d years after 2001 with employment d years after the 1990 peak
Industry-Level OLS Diff-in-Diff Using the LBD(i=industry; t=NBER peak {1990,2001}; d=1:6 years after peak) Industry and peak-year fixed effects (control for cyclicality) DID TermInteraction of indicator variable for 2001 peak and continuous, time-invariant own-industry NTR Gap Industry attributes Cumulative percent change in industry i employment d years after NBER peak t={1981,1990,2001} • Separate regression for d=1:6years after each peak
Basic Industry-Level RegressionsBold=statistically significant at 10% level
Basic Industry-Level RegressionsBold=statistically significant at 10% level Use LBD to examine outcomes 1:6 years after peak, e.g., compare 1981-87, 1990-96, and 2001-2007
Basic Industry-Level RegressionsBold=statistically significant at 10% level • Industries with higher NTR gaps experience larger employment declines following PNTR, as expected
Basic Industry-Level RegressionsBold=statistically significant at 10% level • Absolute magnitude of DID coefficient rises over time; i.e., relative losses are persistent
Basic Industry-Level RegressionsBold=statistically significant at 10% level • Effect attenuated in high K/L industries, magnified in high S/L industries • But these controls generally are not statistically significant
Basic Industry-Level RegressionsBold=statistically significant at 10% level • Multiply DID coefficient by average NTR gap to assess implied impact of PNTR • Post-2001 growth is 3.4 to 15.6 percentage points lower than post-1990 growth
Outline • PNTR • Data • Baseline results • Alternate explanations • Additional results • Conclusion
Alternate Explanations • Alternate explanations must explain: • Timing: employment declines and Chinese imports rise with PNTR in 2001 • Variation across industries: outcomes are larger for industries most affected by the policy change • We consider a wide range of stories…
Alternate Explanations • Changes in Chinese Policy • Lower import tariffs • Elimination of export licensing requirements • Elimination of production subsides • Reduced barriers to foreign investment • Union Resistance in the US • Popped US tech bubble • Rising Chinese competitiveness • End of Textile and Clothing Quotas
Alternate Explanations • Changes in Chinese Policy • Lower import tariffs – Brandt et al. (2013) • Elimination of export licensing requirements – Bai et al. (2007) • Elimination of production subsides – Girma et al. (2007) • Reduced barriers to foreign investment – Nunn (2007) • Union Resistance in the US– unionstats.org • Popped US tech bubble – IT dummy; control for prior growth • Rising Chinese competitiveness– capital and skill intensity • End of Textile and Clothing Quotas– Khandelwal et al. (2013)
Correlation of 1999 Gap with Other Industry AttributesBold=statistically significant at 10% level NTR Gap is: Negativelycorrelated with K/L, S/L, change in Chinese subsidies, and US union membership Positively correlated with contractibility, share of Chinese firms eligible for export licenses, MFA dummy, and advanced technology indicator
Full Specification • Where possible, we include all these covariates and their interactions with a post-PNTR dummy to allow for potential changes in relationships after 2001 • These interactions yield a very flexible specification Now Includes1999 NTR Gap (as before) & All other industry attributes
Implied Impact of PNTR Estimated impact of PNTR is reduced when controlling for alternate explanations but remains substantial
Outline • US-China Trade Policy • Data • Baseline results & Alternate explanations • Additional results • Other Countries • Other Outcomes • Margins of Adjustment • Plant-level • Supply-chain Exposure • Trade • Conclusion
Other Countries • Our paper focuses on effects of a U.S. trade policy • Now we compare employment outcomes in the U.S. to those in EU • Useful test case because EU did not have the policy change that took place in U.S. • EU granted permanent NTR status to China in 1980, did not have annual renewals • We estimate relationship between NTR gap in EU and again in US using an alternative data source (UNIDO) and an alternate specification
US versus EUEmployment Data from UNIDO; Bold indicates statistical significance
US versus EUEmployment Data from UNIDO; Bold indicates statistical significance • U.S. • No effect of NTR gap prior to PNTR
US versus EUEmployment Data from UNIDO; Bold indicates statistical significance • U.S. • No effect of NTR gap prior to PNTR • Negative and significant after PNTR
US versus EUEmployment Data from UNIDO; Bold indicates statistical significance • U.S. • No effect of NTR gap prior to PNTR • Negative and significant after PNTR • E.U. • No effect of NTR gap on employment
US versus EUEmployment Data from UNIDO; Bold indicates statistical significance • U.S. • No effect of NTR gap prior to PNTR • Negative and significant after PNTR • E.U. • No effect of NTR gap on employment • The disparity in outcomes provides further evidence against competing explanations: • technological change • aggregate shocks in China
Outline • US-China Trade Policy • Data • Baseline results & Alternate explanations • Additional results • Other Countries • Other Outcomes • Margins of Adjustment • Plant-level • Supply-chain Exposure • Trade • Conclusion
Examine Other Industry Outcomes Using CM Now turn to CM Only available in years ending in 2, 7 but a rich set of characteristics is available Post-PNTR period is 1997-2007; pre-PNTR period is 1987-1997