Download
1 / 24
240 likes | 433 Views
Explore fish growth patterns, measurement methods, and diet analysis for better fisheries management. Learn how to assess fish condition, growth rates, and dietary habits for sustainable fishing practices.

E N D
FW 479 Feb. 23 and 25, 2004 Fish Diet, Condition, and Growth • Condition: What does it mean? How do we measure if a fish is “healthy”? • Growth: What are typical patterns?, How is growth measured? • Diet: How is it analyzed? What can it tell us?
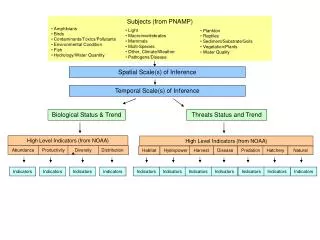
Mgt: Angler Surveys Mgt: Stocking, Aquaculture, Habitat Mgt: Regulations • Fish • Abundance • Size comp. • Age comp. • Behavior • Production • Habitat use Reproduction • Fishers/Anglers • Abundance • Behavior • Attitudes Growth Rates Mortality Rates • Fishery • Catch rates • Harvest • Profit/economics • Satisfaction • Foodweb Effects of Fish & Non-harvest Values • Effects on competitors, prey, and predators • Transfer of nutrients and contaminants
Condition Factor (Fulton’s K): weight length3 Fish Condition Weight typically increases as approx. the cube of length Weight = aLengthb Log(weight) = log(a) + b*log(length) Caveats: e.g., water versus lipids as weight
What are typical patterns of fish growth? Age Age Growth, though indeterminate, often slows after the onset of reproduction. One way to assess growth is to compare mean size at age.
If we integrate, this becomes…. Measuring Growth: von Bertalanffy Age Based on….. von Bertalanffy growth analysis can be conducted with size at age, or mean size at age, data.
annulus Measuring Growth: Back Calculations Fraser Lee Method TL at capture Fish TL TL when scales start growing Scale radius Scale radius at capture
Fraser Lee Back-Calculations annulus TL at capture Back-calculated TL at 2nd annulus Fish TL Back-calculated TL at 1st annulus 1st annulus 2nd TL when scales start growing Scale radius Scale diameter at capture
Note, this relates to the von B: “Typical” Pattern of Growth Rates Annual Growth Increment (mm) Back-calculated TL (mm)
140 120 100 Annual Growth Increment (mm) 80 60 40 20 0 50 100 150 200 25 Back-Calculated TL (mm) Growth Rates: Gizzard Shad example growth increment during 1st year of life TL when scales start growing
120 100 80 Growth Increment (mm) 60 40 20 0 50 100 150 200 Back-calculated TL (mm) Comparing Gizzard Shad Growth Rates
Why do fisheries managers look at so many fish guts? http://biology.usgs.gov/wfrc/cook.web/estuary.htm
Diet-related Questions • What are fish eating? • What’s the best food for fish? • How much are fish eating? Is there enough food? • How are fish affecting other food web components?
Fish Diet Composition • Reason: • general characterization of diet • mainly qualitative in terms of amount eaten • Data required: • gut contents (number and taxa) • Limitations: • relative comparisons of amount of food in gut can be made, but conclusions regarding absolute consumption are tenuous • typically a first step
Fish Diet Composition • Analysis: • % contribution of prey taxa (or size classes) • may be expressed as % by number, by weight, or by calories • IRI = index of relative importance • (% by # + % by volume) * (% freq. of occurrence)
Fish Diet Composition • Analysis: • Stable isotopes From Vander Zanden et al. 1997 CJFAS 54:1142-1158. Trophic position = ((fish δ15N – mussel δ15N)/3.4) + 2
Fish Diet Composition • Stable isotopes From Post 2002 TREE 17(6):269-277
Feeding Selectivity Indices • Reason: • determine what prey types (taxa or size classes) are most important • assumption is that preferred prey are important or beneficial to consumer • Data required: • gut contents AND availability in envt • Analysis: One example is Chesson’s alpha: • ri = proportion of prey item i in diet • pi = proportion of prey item i in environment • n = total number of prey types • 1/n = neutral selection
Feeding Selectivity Indices (cont.) • Analysis (cont.): • EnvtGutSelectivity • rare abundant positive, alpha > 1/n • abundant rare negative (avoidance), alpha < 1/n • rare rare neutral, alpha = 1/n • abundant abundant neutral, alpha = 1/n • Limitations: • can be difficult to interpret without other information • environment sampling must reflect encounter rate
Feeding Selectivity Indices: an example Bremigan 1992
Functional Response Curves • Reason: • determine how foraging behavior and consumption vary as a function of prey density • implications for predator and prey • an important component of predicting total consumption of prey • Data required: number of prey in gut and density of prey in environment • Analysis: Type 2 Type 3 Type 1 # consumed Prey density in environment
Function Response Curves (cont.) • Limitation: • requires a lot of data • easier to quantify in experiments - but how well does it translate to “real world” settings?
Questions If two fish eat the same amount of food, will they necessarily grow the same amount? If two fish grew the same amount, did they necessarily eat the same amount?
Bioenergetics Consumption = Metabolism + Wastes + Growth
Bioenergetics • Typically, actual consumption rate is less than Cmax. • p = a parameter in the model = proportion of maximum consumption. • At maximum consumption, p=1. • The p value provides a relative measure of consumption that can be compared across different temperatures, etc.