Download
1 / 31
310 likes | 446 Views
Effects of Air Pollution on the Health of Older Adults Ron Williams June 14, 2005. Exposure Assessment of Older Adults to Particulate Matter. What Is An Exposure Assessment?. Estimation or direct determination of the potential for humans to be exposed by a given substance

E N D
Effects of Air Pollution on the Health of Older Adults Ron Williams June 14, 2005 Exposure Assessment of Older Adults to Particulate Matter
What Is An Exposure Assessment? • Estimation or direct determination of the potential for humans to be exposed by a given substance • May involve measurements taken at the community, residential or personal level • Typically involves trying to understand not just what people are exposed to, or how much, but also the factors that influence their exposures
Personal Exposure Considerations • Individuals experience adverse health effects from PM in the air they breathe (personal exposure) • Epidemiological studies that show adverse health effects to PM often use ambient monitoring data as an estimate of personal exposure
Sources Atmospheric Chemistry Transport Ambient Monitoring Site Atmospheric Chemistry Source Input Indoor Microenvironment Infiltration Source Input Outdoor Microenvironment Personal Time/Activity Personal Time/Activity Individual Dosimetry Factors, e.g., Ventilation Anatomy Dose Personal Exposure Research Provides the link between source/regulatory monitoring and health outcomes Indoor Microenvironment
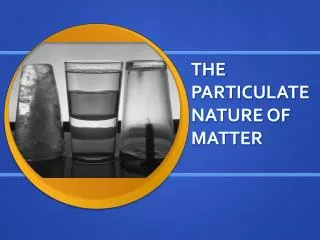
What is Particulate Matter? • PM is a complex mixture of solid, semi-volatile and aqueous materials of various sizes found in the air. • When inhaled, smaller particles generally penetrate more deeply into the lung • The size and composition of PM have important implications regarding health outcomes.
Particulate Matter Specifics • We typically differentiate particles by their aerodynamic diameter and by their composition • EPA currently regulates PM10 and PM2.5 size particles • PM is one of six criteria air pollutants (carbon monoxide, ozone, sulfur dioxide, nitrogen dioxide, lead) that EPA regulates and is a recognized health hazard • Current regulations are believed to account for $120 to $183 billion in annual savings (1992-2002) from prevented ER visits, hospitalizations, and premature deaths)
Why Study the Elderly? • PM exposures have been linked to increased disease, and episodes of ER visits, lung disease, cardiovascular deficits among others. The elderly comprise the largest percentage of those with these diseases • Our susceptibility to environmental hazards increase as we age • In 2000, those 65 years or older represented 12.4% of the US population. This is expected to be 20% by 2030* *2000 Census
Where Do the Elderly Live*? • 4.5% of those over 65 live in communal housing situations (nursing homes) but… • This number dramatically increases as we age (18.2% for those 85+) • Thus it is important to understand how the elderly residing in private homes and various communal settings actually live and how they are exposed to PM *2000 Census
EPA’s PM Panel Studies • PM Panel Studies – • Over 200 individuals, 4000 days, 15,000 personal, residential, and ambient samples • EPA, Harvard, U of Wash, NYU • Baltimore, MD; Fresno, CA; Atlanta, GA; Boston, MA; Los Angeles, CA; Seattle, WA; New York, NY; Research Triangle Park, NC • Elderly, asthmatics, COPD, African Americans w/hypertension, cardiovascular disease • Health data collected in many studies • Evaluate exposures and relationship to ambient monitors
RTP Panel Study Hypertension Implanted defibrilators
What Were They Exposed To? • 46% of the PM was related to sulfate (regional pollutant) • 13.6% of the PM was unknown • 2.8% was soil • 0.7% was related to vacuuming or dusting • 36.2% was related to cooking aerosols, automotive exhaust, etc • 0.4% was related to use of personal care products (antiperspirant, hairspray, makeup) • Infiltration factor of ~0.45 (sulfate)
Influence of Particle Size in Fresno Winter 1999 Spring 1999
Influence of Season in Fresno • The size fraction distribution of PM2.5 and PM10 varied widely during the two seasons of the 1999 Fresno study (winter vs spring) • PM2.5 fraction contribution to the ambient and indoor PM10 mass concentration changed dramatically between winter and spring (ambient: 61 47 %; indoors 69 41%).
A Third Population • The Research Triangle Park studies involved: • A cohort of African-Americans having controlled hypertension (bp <190/100) living in a low-to-moderate SES neighborhood with respect to housing (30 total, 17% males) • A cohort of individuals with implanted cardiac defibrillators (8 total, 63% males), fully ambulatory • Lived in detached homes (average of 167m2;1-80 y.o. mean = 33). Age range of 55-85, mean =65.2 y.o
Personal Activities µg/m3
PM Source Ratios (Compared to Ambient) Non-ambient sources having the greatest potential impact include: Cooking*, burning food*, grooming*, passive ETS*, fireplace use*, tractor exhaust*, yard work, being in auto, use of air conditioning, cleaning, showering, changing litterbox, pesticide spraying. Cooking, cleaning and grooming represent the activities responsible for the most consistent daily non-ambient exposures *by source strength
What Do All Three Studies Tell Us? Conclusions PM mass concentrations indicate: • Ambient concentrations generally = Outdoor >> Personal > Indoor • Ambient trends dominate time series. • For fine PM and sulfate - correlations between central community sites and indoor air or personal exposure are relatively good and the ambient monitor should be an adequate exposure surrogate • However, use of ambient data alone for epi studies may not be able to show some causal relationships due to personal exposure factors typically on the order of 50%. This might result in an underestimation of potential risk.
PM2.5 Mean Mass Concentrations Personal Home indoors B F I F2 RTP B F I F2 RTP Ambient Outdoors F I F2 RTP B F I F2 RTP B
Introduction of Sources and Activities Complicates Relationships Pearson Correlations
Disease State – Not Critical *Wallace et al., EPA/600/R-03/145
Season and Location • Season was not a major factor in the RTP, but 2000-2001 was a very mild winter • Residential location was not a significant factor (35 homes across 70 km of the RTP). Some individual variability was evident • However, Fresno data indicated season had a major impact on potential exposures to different PM size fractions
Housing Considerations • In the absence of indoor sources (e.g., tobacco smoke, cooking aerosols), outdoor air infiltrating inside highly impacts the air we breathe. In most cases, ~45% of what the elderly were exposed to was ambient air • The setting in which the elderly live (e.g., communal apartment, individual home) and their activities greatly influence the impact of ambient air exposures.
Acknowledgements • Lance Wallace, Jack Suggs, Anne Rea, Teri Conner, Alan Vette, Matt Landis, Gary Norris, John Creason, Linda Sheldon (EPA) • Charles Rodes (RTI International) • Lee-Jane S. Liu (Univ of Washington) Although this work was reviewed by EPA and approved for publication, it may not necessarily reflect Official Agency policy.