Download
1 / 43
430 likes | 545 Views
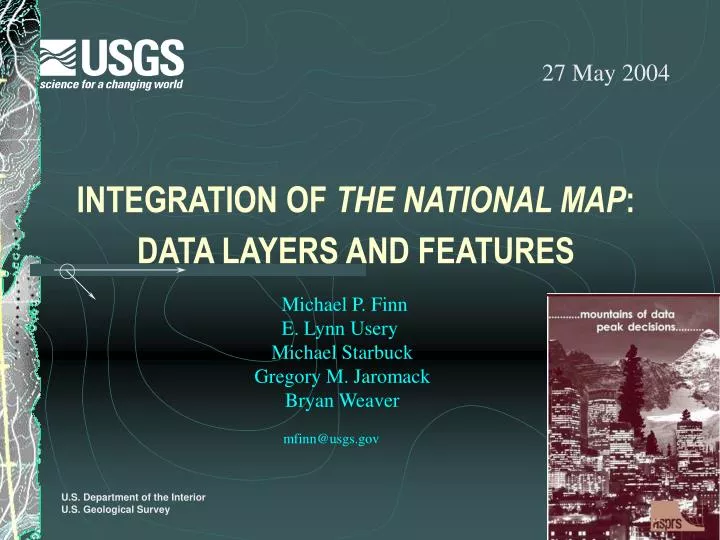
INTEGRATION OF THE NATIONAL MAP : DATA LAYERS AND FEATURES. Michael P. Finn E. Lynn Usery Michael Starbuck Gregory M. Jaromack Bryan Weaver. 27 May 2004. mfinn@usgs.gov. Outline. Goals and Objectives Approach Data Test Sites Methods Conclusions. Goals and Objectives.

E N D
INTEGRATION OF THE NATIONAL MAP: DATA LAYERS AND FEATURES Michael P. Finn E. Lynn Usery Michael Starbuck Gregory M. Jaromack Bryan Weaver 27 May 2004 mfinn@usgs.gov
Outline • Goals and Objectives • Approach • Data • Test Sites • Methods • Conclusions
Goals and Objectives • The National Map will consist of integrated datasets • Current USGS digital products are single layer and not vertically-integrated • The goal is to develop procedures for automated integration based on metadata • Framework for layer integration based on metadata • Framework for feature integration • Example results for Atlanta and St. Louis
Integrating Disparate Networks Conceptual Data Flow: Federated Database design – Local schemas mapped to a global schema for attribute conflation and maintenance. Physical Integration Processes: Vertical Integration = Cross-thematic topological integrity Horizontal Integration = Same-theme edge-matching
Approach • Layer-based • Use existing seamless datasets • Determine integration feasibility based on resolution and accuracy • Feature-based • Implement integration on feature by feature basis • Use developed feature library
Data • Orthoimages from Nunn-Lugar-Domenici 133 priority cities of the Homeland Security Infrastructure Program • National Hydrography Dataset (NHD) • National Elevation Dataset (NED) • Transportation (DLG, TIGER, State DOT, others) • National Land Cover Dataset (NLCD, others)
Test Sites • St. Louis, Missouri • Initially the Manchester and Kirkwood quadrangles • Atlanta • Initially the Chamblee and Norcross quadrangles
Challenges Facing TNM: Institutional Masser and Campbell (1995) • Variation in participant priorities • Variation in GIS experience among participants • Differences in spatial data handling The more participants in a data sharing program, the greater organizational complexity (Meredith, 1995; Fountain, 2001). Azad et al. (1995) found an inverse relationship between the interdependency of participants and the likelihood of program success.
Challenges Facing TNM: Technical Most datasets are outdated and inaccurate:
Challenges Facing TNM: Technical Horizontal data integration:
Technical Factors Complicating Integration: • Total length of coincident participant boundaries • Road network feature density at the participant boundaries • Complexity (attribute precision) of the global schema
Methods • Layer integration • Determine compatible resolutions and accuracies and use metadata to automatically combine appropriate datasets • Determine transformations possible that integrate datasets of incompatible resolutions and accuracies • Determine limits of integration based on resolution and accuracy
Cartographic Transformations from Keates • Sphere to plane coordinates – projection • Mathematical, deterministic, correctable • Three-dimensional to two-dimensional surface • Mathematical, deterministic, correctable • Generalization • Non-mathematical, scale dependent, humanistic, not correctable
Scale and Resolution Matching (Mathematical Transformations) • Working postulate: If data meet NMAS (NSSDA), then integration can be automated based on the scale ratios • If linear ratios of scale denominators are >= ½ , then integration is possible through mathematical transformations (12 – 24 K = 0.5) • For ratios < ½ , generalization results in incompatible differences (12 – 48 K = 0.25)
Generalization Issues • Selection – common features may not appear on data layers to be integrated (Topfer’s Radical Law) • Simplification – lines may contain reduced numbers of points and have different shapes • Symbolization – for map sources, symbolization may result in areas shown as lines or points • Induction – features may have been interpolated and appear differently on different sources
Feature Integration • Metadata exists on a feature basis • Accuracy, resolution, source are documented by feature • Use Feature Library with an integration application
Conclusions • Data integration of layers for The National Map can only be accomplished with datasets that are compatible in resolution and accuracy • Mathematical transformation can automate integration with limited ranges of scales, but cannot correct generalization differences • The National Map road data will leverage the U.S. Census Bureau’s TIGER Enhancement Program and local data providers • Technical integration (horizontal and vertical) and institutional integration present many challenges to partnering
INTEGRATION OF THE NATIONAL MAP: DATA LAYERS AND FEATURES Michael P. Finn E. Lynn Usery Michael Starbuck Gregory M. Jaromack Bryan Weaver 27 May 2004 http://mcmcweb.er.usgs.gov/carto_research/
Catalog Data Model, v1 Map Services are software, located through a URL Partners are organizations Layers are spatial data, managed by a service Partners Services Layers One partner can run many map services One map service can have many data layers Service Examples MetroGIS WMS TerraServer USA MSDIS WMS USGS NHD WMS Partner Examples LMIC (MN) Microsoft MSDIS (MO) USGS data programs Layer Examples Highways DOQ county_boundaries NHD_Network 2166 layers, 623 visible to the public 2/24/04 106 services 2/24/04 53 partners 2/24/04