Download
1 / 1
10 likes | 136 Views
P2. Validation of the WRF-Fire model with observation data from a prescribed fire experiment. X. Bian, W. Heilman, J. Charney, J. Hom, K. Clark, N. Skowronski, M. Gallagher, M. Patterson USDA Forest Service, East Lansing, MI. S. Lai, S. Zhong, M. Kiefer, L. Pei, X. Zhu

E N D
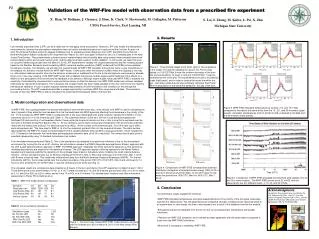
P2 Validation of the WRF-Fire model with observation data from a prescribed fire experiment X. Bian, W. Heilman, J. Charney, J. Hom, K. Clark, N. Skowronski, M. Gallagher, M. Patterson USDA Forest Service, East Lansing, MI S. Lai, S. Zhong, M. Kiefer, L. Pei, X. Zhu Michigan State University 1. Introduction Low-intensity prescribed fires (LIPF) can be a viable tool for managing forest ecosystems. However, LIPF may modify the atmospheric environment by inducing fire-atmosphere interactions that can lead to turbulence production in and around the fire front. As part of a Joint Fire Science Program project to develop modeling tools for predicting smoke dispersion from LIPF, the USDA Forest Service - Northern Research Station conducted LIPF experiment son March 20, 2011 and again on March 6, 2012 on 2 forested plots in the New Jersey Pine Barrens. These experiments collected various meteorological and air-quality data using several meteorological towers and surface stations within and around the burn plots, and the data have been used for model validation. In this poster, we report the work on using the meteorological data from the March 6, 2012 LIPF experiment to validate the coupled atmosphere and fire modeling system based on the Weather Research and Forecasting (WRF) numerical weather prediction (NWP) model and the SFIRE surface wildland fire behavior module. For simplicity, we will refer this coupled model as WRF-FIRE hereafter, although the name is give nspecifically to the wildland fire behavior module within the WRF NWP model. Unlike some other fire behavior models where the coupling is one-way, i.e., atmospheric data are used to drive the fire behavior model and no feedback form the fire to the atmospheric environment is allowed, the in-core or two-way coupling of the WRF NWP model with a wildland fire physics module allows explicit treatment of the effects of a wildfire on the atmospheric environment and the feedback to fire behavior. Although recent studies have used WRF-FIRE to examine the sensitivity of simulated fire characteristics to external factors known to affect fire behavior, the WRF-FIRE model has not been validated extensively by real-world observations. This is because the coupled model has been made available to the user community only recently and because validation of such a system requires detailed measurements of both fire behavior and conditions of the atmosphere surrounding the fire. The LIPF experiment provides a unique opportunity to evaluate WRF-Fire using real-world data. The evaluation focuses on how well WRF-FIRE is able to reproduce the observed meteorological fields in the burn plot. 3. Results Time(UTC) Time(UTC) Time (UTC) Time (UTC) Time (UTC) Figure 3. WRF-FIRE simulated temperatures at surface, 2 m, and 10 m AGL compared to the data at the same levels from the 10-, 20-, and 30-m towers (upper panels); simulated temperatures at 20 m and 30 m AGL compared to the data from the 30-m tower (lower panels). Figure 2. Three sample stages (from left to right) of fire progression in the model. The red line indicates the area of fire. The fire was ignited at 1100 EDT Mar. 6 near the southern boundary of the burn plot and continued for 14 hours to end at 0100 EDT Mar. 7 near the northwest corner of the plot. The experimental burn plot is bounded by roads (right panel), and in order to confine the model fire within the plot , fuel data outside the plot were artificially removed. See Poster P9 for a description of the actual fire spread on the day of the burn. TKE(m2/s2) TKE(m2/s2) Figure 4. Comparisons of WRF-FIRE simulated and observed distribution histograms of turbulent kinetic energy (TKE) at 20 m and 30 m above ground level (AGL) on the 30-m tower for the entire fire period from 1500 UTC, Mar 6 to 0500 UTC, Mar 7, 2012. 2. Model configuration and observational data In WRF-FIRE, the coupling between fire and the atmospheric environment is two-way: wind velocity from WRF is used in calculating the rate of spread of fires while the heat released from the fire feeds back into WRF dynamics affecting the atmosphere in the vicinity of the fire. For this study, the WRF NWP model is configured with 4 two-way nested grids with a grid resolution ranging from 6250 m in the outermost grid to 50 m in the innermost grid (Table 1). The outermost domain is 500 km x 500 km in size that encompasses the Northeast US and a portion of northwestern Atlantic Ocean while the innermost domain is 4 km x 4 km in size that is centered over the burn plot in the New Jersey Pine Barrens (Fig. 1). All four domains use the same vertical grid configuration with 43 vertically stretched levels with the lowest level at about 7 m above ground level (AGL). At the surface of the innermost grid, 10x10 fire cells occur within each atmospheric cell. The time-step for WRF is 15 s for the outermost grid and 0.56 s for the innermost domain. The static surface data needed by the WRF-Fire model are downloaded from the Landfire website (http://landfire.cr.usgs.gov/viewer/), which includes the U.S. 13 Anderson fire behavior fuel model data and topographic elevation data, all at 30 m resolution. The surface fuel at each point is specified categorically using 13 standard fire behavior fuel models. Four simulations were performed (Table 2). Two of the simulations are designed to examine the influence of fire on the atmospheric environment by turning the fire on or off. Another two simulations compare the RANS (Reynolds-average Navier-Stokes) approach with the LES (Large-eddy simulation) approach in WRF. The RANS approach integrates the whole turbulence spectrum so that turbulence modeling assumptions are required for the statistical closures. The LES approach applies a filtering operation to the Navier-Stokes equations and resolves explicitly the dynamics of the unsteady large scales of turbulence while modeling the small scale turbulence motions. All four simulations were run for 36 hours starting at 00:00 UTC, Mar. 6, 2012 and continuing until 12:00 UTC, Mar. 7, 2012, with 6 hours of spin-up time. The model was initialized with data from the North American Regional Reanalysis (NARR). For the two simulations with fire, the fire was ignited near the southern boundary of the plot at 1500 UTC (1100 EDT) Mar. 6 and continued for 14 hours to end at 0500UTC (0100 EDT) Mar. 7 near the northwest corner of the plot (Fig. 2). The simulated results are compared to data collected on 3 towers in the burn plot during the LIPF experiment on March 6 and 7, 2012. Three-dimensional sonic anemometers (10-Hz: U, V, W, T) were mounted at 3, 10, and 30 m above ground level (AGL) on a 30-m tower; at 3, 10, and 20 m AGL on a 20-m tower; and at 3 and 10 m AGL on a10-m tower. For detailed tower locations and other information, please refer to Poster P9 by Heilman et al. Table 1. WRF-Fire model domain configuration ____________________________________________ Domains D1 D2 D3 D4 Resolution (m) 6250 1250 250 50 Grid Points (EW) 81 101 71 81 Grid Points (NS) 81 101 71 81 Vertical Layers 43 43 43 43 ____________________________________ Table 2. List of numerical simulations _____________________________________ Simulation cases Fire LES No Fire No LES No No No Fire With LES No Yes With Fire No LES Yes No With Fire With LES Yes Yes _____________________________________________ Time (UTC) Figure 5. Comparison of WRF-FIRE simulated and observed wind speeds (m/s) at the 30-m tower location. The WRF-FIRE results are at 22 m AGL and the observations are at 4 different levels: 3, 10, 20, and 30 m AGL. Figure 1. The four 2-way nested WRF-FIRE model domains centered over the forested burn plot on March 6, 2012 in the New Jersey Pine Barrens. • 4. Conclusion • Our preliminary results suggest the following: • WRF-FIRE simulated temperatures and wind speeds/directions in the vicinity of the fire agree reasonably well with the observations. The simulated winds are somewhat stronger compared to the observed winds in all experiments; in other words, the bias in wind speed is not a result of the feedback from the fire module. • Simulations without the feedback from the fire (no fire run) produced lower temperature and weaker turbulence. • Results from WRF LES simulation are in somewhat better agreement with the observations compared to those from the WRF RANS simulation. • More work is necessary in validating WRF-FIRE. Acknowledgments. Funding for this research was provided by the U.S. National Fire Plan , the U.S. Joint Fire Science Program (Project # 09-1-04-1), and the USDA Forest Service (Research Joint Venture Agreement # 09-JV-11242306-089).