Decision Making for Results
Decision Making for Results. Part One: Objectives. Develop a deeper understanding of the Decision Making for Results: Data-Driven Decision Making process Increase awareness of the relevance of data and its impact on leadership, teaching, and learning


Decision Making for Results
E N D
Presentation Transcript
Part One: Objectives • Develop a deeper understanding of the Decision Making for Results: Data-Driven Decision Making process • Increase awareness of the relevance of data and its impact on leadership, teaching, and learning • Reinforce the importance of collecting both cause and effect data
Objectives Apply the Decision Making for Results: Data-Driven Decision Making process to monitor leadership, teaching, and learning Implement the Decision Making for Results: Data-Driven Decision Making process to monitor school improvement
Principles ofDecision Making For Results Antecedents Accountability Collaboration
Seminar Overview • Introduction • Building the foundation • Process and application • Action planning
Becoming Data Driven How are you currently embracing a data-driven decision-making process that leads to results?
Results-Driven Schools • Where is the proof? • 90/90/90 Schools, Reeves 2003 • Education Trust, 2002 • NCREL, 2000 • Consortium for Policy Research in Education, 2000 • EdSource, 2005 • Northern Illinois University Center for Governmental Studies, 2004 Data Driven Decisions
Reflection “The value of the data emerges only when analysis provides insights that direct decisions for students.” White, 2005
Part TwoBuilding the Foundation • Cause data and effect data • Continuous improvement cycle • Principles and processes of Decision Making for Results: Data-Driven Decision Making
“Only by evaluating both causes and effects in a comprehensive accountability system can leaders, teachers, and policymakers understand the complexities of student achievement and the efficacy of teaching and leadership practices.” Reeves, 2006
Effect data: Outcomes or results Cause data: Professional practices that create specific effects or results Definitions and Examples
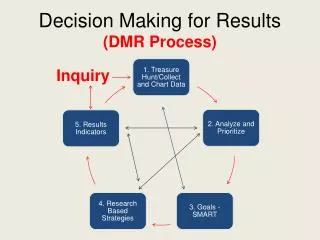
The Process for Results Treasure Hunt Analyze to Prioritize Inquiry; Develop Questions SMART Goals Monitor & Evaluate Results Results Indicators Specific Strategies
Inquiry “Data-driven decision making begins by asking fundamental questions.” Doug Reeves • What questions do you have about teaching and learning in your school? • What data sources are you using to gather the specific information?
Step 1: Conduct a Treasure Hunt • Why? To gather and organize data in order to gain insights about teaching and learning practices • Considerations • Measures of data • Disaggregation • Triangulation • Reflection
Measures of Data • Student learning • Demographics • Perceptions • School processes—Behaviors within our control: instructional and leadership strategies, programs and resources, and organization
Disaggregation • To separate something into its component parts, or break apart • “Disaggregation is not a problem-solving strategy. It is a problem-finding strategy.” Victoria Bernhardt, Data Analysis, 1998 Think, pair, share: What data do you disaggregate and how do you use the information?
TriangulationA Look at Learning DRA Running Records Benchmark
Case Study • Read case study • Part 1: How did they categorize the different data sets and record their observations? • Part 2: What did they discover?
Conduct a Treasure Hunt Application • Review inquiry questions • Conduct a “Treasure Hunt” • Organize data on templates • Use rubric to monitor and evaluate your work
Can You Identify with This? “It is not so much a lack of data, but an absence of analysis, and an even greater absence of actions driven by the data.” White, 2005
Step 2Analyze Data to Prioritize Needs Data Analysis at Northside Middle School
Analyze Data to Prioritize Needs • Why? To identify causes for celebration and to identify areas of concern • Considerations • Strengths • Needs • Behavior • Rationale
Quality Prioritization • Why? To take immediate action on the most urgent needs • Quality prioritization requires a thorough understanding of: • Student population • Curriculum and Power/Priority Standards (leverage, readiness) • Antecedents affecting student achievement • Quality of program implementation White, 2005
Case Study • Review case study • What insights did you gain after reading analysis of student performance? • Make a recommendation: What is the most urgent need?
Review, Analyze, and Prioritize Application • Review data from Step 1 • Conduct analysis using the guiding questions • Prioritize urgent needs using the suggested criteria • Record your work on the templates • Use rubric to monitor and evaluate your work
Step 3Establish SMART Goals • Why? To identify our most critical goals for student achievement based on the challenges that were identified through the inquiry process • Specific, Measurable, Achievable, Relevant, Timely
Establish Your SMART Goals Application • Review prioritized needs • Review Treasure Hunt baseline data • Apply SMART goal formula, use templates • Use rubric to monitor and evaluate your work
Goals—Application • Review prioritized needs • Review Treasure Hunt baseline data • Apply SMART goal formula, use templates to record your work • Use rubric to monitor and evaluate your work
Share Your Findings with Colleagues • Meet in the middle of the room • Be prepared to share your findings from Steps 1-3 • Highlight one celebration from a colleague
Step 4Select Specific Strategies Let’s watch Lake Taylor High School as they dialogue about strategies
Select Specific Strategies • Why? • Adult actions will impact student achievement • Strategies are— • Action-oriented • Measurable/accountable • Specific • Research-based • Considerations: Instructional, organizational, leadership, programmatic
Research-Based Strategies • Reeves, D.B. (2003. 90/90/90 schools. Retrieved from www.leadandlearn.com • Reeves, D.B. (2006). Ten things high schools can do right now to improve student achievement. Retrieved from http://www.leadandlearn.com/resources/custom/Presentations/4.2.08.NY.NYC.pdf • Learning 24/7 Observation Study (2005).What’s happening in schools? Or not?
Additional Evidence in Support of Research-Based Strategies • Zemelman, S., Daniels, H., & Hyde, A. (2005). Best practice. Portsmith, NH: Heinemann. • Marzano, R. (2007). The art & science of teaching. Alexandria, VA: ASCD. • Barr, R., & Parrett, W.H. (2007). The kids left behind. Bloomington, IN: Solution Tree. • Marzano, R., Waters, T., & McNulty, B. (2005). School leadership that works. Alexandria, VA: ASCD.
Let’s Do It! Guided Practice
Case Study • Revisit case study analysis • What types of strategies (instructional, organizational, leadership, programmatic) did they select? • How will the strategies help students overcome the obstacles?
Select Your Specific Strategies • Revisit your prioritized needs • Research the best possible strategies to meet the learner needs • Group by type of strategy: Instructional, organizational, programmatic, and leadership • Use rubric to monitor and evaluate your work
Step 5Determine Results Indicators Why? To monitor the degree of implementation and evaluate the effectiveness of the strategies
Results Indicators • Considerations • Serve as an interim measurement • Used to determine effective implementation of a strategy • Used to determine if strategy is having the desired impact • Help to determine midcourse corrections
Case Study • Review case study • How will their results indicators serve as an interim measurement? • How clearly will the results indicators help to monitor implementation and impact?
Results Indicator Application • Revisit strategies (Step 4) • Develop results indicators • Use rubric to monitor and evaluate your work
“Improvement cycles require leadership follow-up and relentless efforts to maintain the focus on data if decisions are truly going to be driven by informed data.” White, 2005
Step 6Monitor and Evaluate Results Why? To engage in a continuous improvement cycle that— • Identifies midcourse corrections where needed • Adjusts strategies to assure fidelity of implementation
Case Study • Review the case study • How did they monitor strategies? • Was there any evidence of midcourse corrections?
Develop Your Monitoring Plan • Review your work from developing questions to determining results indicators then determine how you will monitor the strategies. When you create your monitoring plan consider: • Teacher or administrator teams • Monitoring cycles • Goals • Strategies • Impact on student and adult behavior • Ability to make midcourse corrections