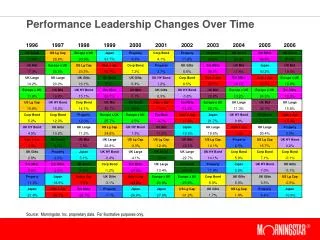
Visualizing Changes Over Time in Datasets Using Dynamic Hierarchies
Explore how to compare tree structures over time, identify nodes changes, and create interactive visualizations for data analysis. Learn through 13 case studies the effectiveness of TreeVersity tool in revealing patterns.

Visualizing Changes Over Time in Datasets Using Dynamic Hierarchies
E N D
Presentation Transcript
Visualizing changes over time in datasets using dynamic hierarchies John Alexis Guerra Gómez @duto_guerra john.guerra@gmail.com Michael L. Pack, Catherine Plaisantand Ben Shneiderman May. 22th 2013 HCIL Symposium Human-Computer Interaction Lab & Center For Advanced Transportation Computer Science Department University of Maryland Twitter: @duto_guerra http://treeversity.cattlab.umd.edu
Trees are everywhere… A speculatively rooted tree for rRNA genes, showing major branches Bacteria,Archaea, and Eucaryote. http://en.wikipedia.org/wiki/Phylogenetic_tree http://www.ncaa.com
…and we are really good with them TreeMaps [Johnson & Shneiderman 1991] SpaceTree [Plaisant, Grosjean & Bederson 1998] Visualizing Navigating Storing, Computing, etc…
Comparing trees is more complicated! What about comparing them?
Tree • Set of nodes and links that express the parent-to-child relationship. • Where each node: • Is uniquely labeled in the tree. • Contains one or more numeric variables with values over time. • Contains one or more categorical attributes that may have more than one value.
Types of Trees Mixed Dynamic Fixed State Gender Gender County Ethnicity State City Age range City
Types of Tree Comparison Addressed by related work Node value changes Partially addressed by related work No Yes Addressed by TreeVersity New! No Topology changes New! Yes Leaf values (aggregated trees) Values in all nodes
Comparing two trees using node values and created and removed nodes How to compare two trees?
The StemView Actual Change (Color) Direction Relative Change (Height) Created Node (black border ) Removed node Ending Value (Width)
Acknowledgements • Fulbright Science and Technology Scholarship • Center for Integrated Transportation Systems Management (a Tier 1 Transportation Center at the University of Maryland) • Center for Advanced Transportation Technology Laboratory (CATT Lab) • Audra Buck-Coleman • All of our domain experts
Thank you! StemView: shows 5 characteristics of change in all the nodes of a tree Reporting tool: helps users navigating changes in the tree http://treeversity.cattlab.umd.edu • ww John Alexis Guerra Gómez @duto_guerra jguerrag@cs.umd.edu
My thesis in one minute Summary
Visualization Technique: the Bullet Relative Change (Height) Direction of change Created node Actual Change (Color) Removed node
“But, what if we want to see the changes in the budget for the last 20 years?”
Comparing one tree over multiple points in time with node values and created and removed nodes How to find what changed on one Tree over time
13 case studies with 9 partners 13 Case Studies that revealed strengths & weaknesses
Exit questionnaire q1: For this particular case study TreeVersity was: q2: In general the tool is likely to be: q3: Did the reporting tool help direct your exploration? q4: Did you find the StemView comprehensible? q5: Did you find the Bullet comprehensible? q6: Would you like to continue working with Treeversity? q7: Would you be willing to install and use Treeversity on your own? q8: How does this compare to your original expectations before starting with the tool.
“The work I can achieve with TreeVersity is equivalent to years of analysis with our previous methods” “TreeVersityeasily showed us multi-years of the data in a graphical form at once without having to download the data into excel and create graphics. We can do that analysis now, but TreeVersity was much quicker.” “I've spent many hours in color coded Excel files expressing changes at query and category levels. The visualization and what changed views made this process much more efficient and easier to share.” “Numerous examples of obvious, but heretofore unrevealed patterns were discovered.” “We use Hyperion and excel for analysis. However, TreeVersity made it much easier to see multi-year trends.”
Design of the Bullet + Implementation on TreeVersity Design of the StemView + Implementation on TreeVersity2. Design and implementation of the Reporting Tool. 13 Case Studies that revealed strengths & weaknesses
Publications Published • K. Wongsuphasawat, J. A. Guerra Gómez, C. Plaisant, T. D. Wang, M. Taieb-Maimon, and B. Shneiderman, “LifeFlow: visualizing an overview of event sequences,” in Proceedings of the 2011 annual conference on Human factors in computing systems - CHI ’11, 2011, p. 1747. • J. A. Guerra Gómez, K. Wongsuphasawat, T. D. Wang, M. L. Pack, and C. Plaisant, “Analyzing incident management event sequences with interactive visualization,” in Proceedings of the Transportation Research Board 90th annual meeting, The National Academies, 2011. • J. A. Guerra Gómez, A. Buck-Coleman, C. Plaisant, and B. Shneiderman, “TreeVersity: Comparing tree structures by topology and node’s attributes differences,” in Visual Analytics Science and Technology (VAST), 2011 IEEE Conference on, 2011. • J. A. Guerra Gómez, A. Buck-Coleman, C. Plaisant, and B. Shneiderman, “TreeVersity: Visualizing Hierarchal Data for Value with Topology Changes,” in Proceedings of the Digital Research Society 2012: Bangkok Vol 2, 2012, no. July, pp. 640–653. • J. A. Guerra Gómez, A. Buck-Coleman, M. L. Pack, C. Plaisant, and B. Shneiderman, “TreeVersity: Interactive Visualizations for Comparing Hierarchical Data Sets,” in Proceedings of the 2013 Transportation Research Board Annual Meeting, 2013. Recognized with the Greg Herrington Award for Excellence in Visualization Research by the TRB Visualization in Transportation Committee. • J. A. Guerra Gómez, M. L. Pack, C. Plaisant, and B. Shneiderman, “Visualizing changes over time in datasets using dynamic hierarchies,” HCIL Tech Report 2013-06, 2013. [Online]. Available: http://hcil2.cs.umd.edu/trs/2013-06/2013-06.pdf. (Under review VisWeek 2013) Tech Reports • J. A. Guerra Gómez, “MySocialTree: Browsing the Facebook Feed Using Hierarchies,” HCIL Tech Report 2011-29, Dec-2011. [Online]. Available: http://hcil.cs.umd.edu/trs/2011-29/2011-29.pdf. • J. A. Guerra Gómez, A. Buck-Coleman, C. Plaisant, and B. Shneiderman, “Interactive Visualizations for Comparing Two Trees With Structure and Node Value Changes,” HCIL Tech Report 2011-22, Sep-2011. [Online]. Available: http://hcil2.cs.umd.edu/trs/2011-22/2011-22.pdf. • J. A. Guerra-Gomez, A. Buck-Coleman, C. Plaisant, and B. Shneiderman, “TreeVersity: Interactive Visualizations for Comparing Two Trees with Structure and Node Value Changes,” HCIL Tech Report 2012-04, 2012. [Online]. Available: http://hcil2.cs.umd.edu/trs/2012-04/2012-04.pdf. • J. A. Guerra Gómez, M. L. Pack, C. Plaisant, and B. Shneiderman, “Visualizing changes over time in datasets using dynamic hierarchies,” HCIL Tech Report 2013-06, 2013. [Online]. Available: http://hcil2.cs.umd.edu/trs/2013-06/2013-06.pdf.