Motivation:
A Multi-spectral Analysis of Tropical Cyclone Cloud Tops from Combined Satellite and High-Altitude Aircraft Remote Sensing Christopher Velden*, Sarah Monette*, Andrew Heidinger^, Edward Zipser , Peter Black # , Gerald Heymsfield ★

Motivation:
E N D
Presentation Transcript
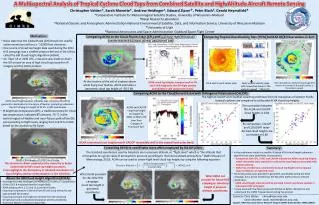
A Multi-spectral Analysis of Tropical Cyclone Cloud Tops from Combined Satellite and High-Altitude Aircraft Remote Sensing Christopher Velden*, Sarah Monette*, Andrew Heidinger^, Edward Zipser, Peter Black#, Gerald Heymsfield★ *Cooperative Institute for Meteorological Satellite Studies, University of Wisconsin-Madison #Naval Research Laboratory ^National Oceanic and Atmospheric Administration-National Environmental Satellite, Data, and Information Service, University of Wisconsin-Madison University of Utah ★National Aeronautics and Space Administration-Goddard Space Flight Center • Motivation: • Rules state that the Global Hawk (GH) should not overfly active convection without a ~10,000 foot clearance. • One source of cloud top height data used during the 2012 HS3 campaign was a satellite product derived at the UWisc. called the ABI Cloud Height Algorithm (ACHA). • On Sept. 14 at 2200 UTC, a decision was made to divert the GH around an area of high cloud tops based on IR imagery and the ACHA product. Comparing ACHA to the Cloud Physics Lidar (CPL) and Scanning High-resolution Interferometer Sounder (S-HIS) aboard the GH: Comparing Tropical Overshooting Tops (TOTs) to NASA DC-8 Observations in Earl: At the location of the tail of airplane above while flying over Nadine, ACHA estimates a geometric cloud top height of ~50.5 kft. ACHA cloud top heights compare well to CPL and S-HIS heights for the GH flight portion over Nadine’s cold convection (circle). TOTs identified by a CIMSS IR-based algorithm close to the strong DC-8 updraft profiles in the eastern eyewall. DC-8 east to west center-pass. Note vertical velocity spike with convective tower in the eastern eyewall ~1916 UTC. Comparing ACHA to the Cloud-Aerosol Lidar with Orthogonal Polarization (CALIOP): The highest CALIOP and CloudSat cloud top estimates from 42 overpasses of western Pacific tropical cyclones are compared to collocated ACHA cloud top heights. ACHA cloud height product indicates tops in excess of 54 kft (in geometric coordinates) in the region of Nadine, prompting a diversion. The GH is flying at a height of 59 kft in GPS coordinates. The correlation between the ACHA and CALIOP cloud heights is 0.66. ACHA and CALIOP cloud top height on August 31, 2010, at 0615 UTC over then Category 4 Hurricane Earl. • IR brightness temperature (BT), a traditional proxy for cloud top temperature,indicates BTs around -75 °C in the central region of Nadine and near-future path of the GH, corresponding to flight levels ranging from FL470 to FL500 based on the analysis by Ed Zipser. By comparison, CALIOP and CLOUDSAT radar-derived cloud heights are correlated at 0.80 ACHA estimated cloud heights match CALIOP reasonably well in the eyewall and outer band. Converting ACHA to coordinates more often employed by the GH pilots: The standard coordinates used by GH pilots are in pressure altitude, or “flight level”, which is “the altitude that corresponds to a given value of atmospheric pressure according to the ICAO standard atmosphere.” (AMS Glossary of Meteorology, 2013). ACHA can be used to create flight level cloud top heights by using the following equation: • Summary: • In this preliminary study, the satellite IR-based ACHA cloud height estimation • algorithm has some identifiable characteristics: • Comparison with CPL, S-HIS, and CALIOP indicate the ACHA cloud top heights match reasonably well, especially in cold active cloud regions associated with tropical cyclones. • ACHA has a tendency to underestimate cloud top heights in less opaque cloud conditions; an expected result. • The ACHA product was provided in geometric coordinates during the 2012 campaign, but a lesson learned was the GH pilots prefer pressure altitude coordinates. • ACHA cloud height estimates will be provided in both coordinate systems in subsequent HS3 campaigns. GOES-13 IR image at 22 UTC on 14 Sept. This decision to divert emphasizes the necessity to better understand ACHA’s cloud top height accuracies. It also highlights the discrepancy in standard coordinates for cloud heights used by meteorologists vs. the GH pilots. What ACHA provided for the 2012 HS3 campaign: cloud top height in geometric coordinates. What ACHA can provide for future HS3 campaigns: cloud top height in pressure altitude coordinates. • About the ABI Cloud Height Algorithm (ACHA): • Developed by Andy Heidinger (NOAA/NESDIS at UWisc.) in preparation of the GOES-R Advanced Baseline Imager (ABI). • ACHA employs the 11, 12 and 13.3 µm LW-IR bands. • Cloud-top temperature is derived from BT and cloud emissivity and optical depth information. • Cloud-top pressure and height are derived from the cloud-top temperature and a collocated temperature profile provided by Numerical Weather Prediction data (GFS). • Future work with the Zipser group will attempt to better characterize and • understand the CIMSS Tropical Overshooting Top product Contacts: Chris Velden chrisv@ssec.wisc.edu Sarah Monette sarah.monette@ssec.wisc.edu Support: NASA Hurricane Science Research Program (HSRP) Grant Number: NNX12AK63G