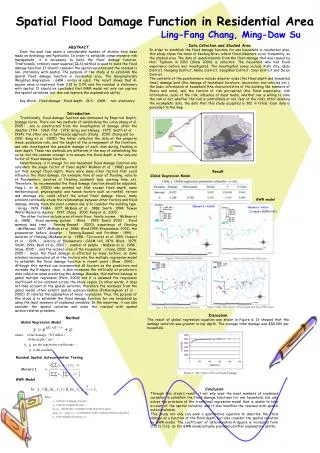

Quantifying Health Benefits of Cleaner Fuel: A Comprehensive Approach
E N D
Presentation Transcript
Damage Function Models Dave Stieb
“And it was so typically brilliant of you to have invited an epidemiologist”
Sulphates ¯ SO2¯ NOX ¯ VOCs¯ CO ¯ Quantifying Health Benefits Cleaner fuel Improved ambient air quality Improved public health $/QALY Value to society Reduced vehicle emissions Reduced population exposure
Representing the weight of evidenceHow do you choose a parameter value? • Expert judgment • Flexible, streamlined • Can be seen as arbitrary • Systematic overview and meta-analysis • Rigorous, comprehensive • Rigid, cumbersome • Structured “consensus” process (eg. Delphi), expert elicitation • Middle ground
Dealing with uncertainty • WHAT IF the parameter were different? • Sensitivity analysis • Run the analysis a few times and see how the results change • Probabilistic analysis • Run the analysis thousands of times (iterations) • For each iteration, pick a different value for each parameter, from an input distribution • The results are also presented as a distribution: “most likely value of benefits is y, but could be as low as x and as high as z”
1996 – • Numerous policy applications: • Acidifying emissions • AQOs • Sulphur in gas • CWS • Climate change co-benefits • Peer reviewed
Canadian gasoline sulphur levels ranged from <10 to 1000 ppm with national average of 340 ppm • In 1999, federal regulation took effect to reduce average sulphur content of gasoline to 30 ppm by 2005
ESTIMATED* CASES AVOIDED premature 53 mortality hospital 60 admissions 168 emergency room visits increased severity of effect 187 chronic bronchitis 2,300 bronchitis in children 39,000 restricted activity days 82,300 asthma symptom days 281,400 acute respiratory symptoms March 23, 1998 Findings of Health Panel for seven cities only, in 2001- Reducing sulphur to 30 ppm improves the health of Canadians
Benefits for Year 2001 by type for 4 alternative scenarios; central, low and high estimates
Health Benefits vs. Refinery Costs ( 45% of CanadianPopulation ) Benefits and costs based on 30 ppm (total population)
To do list • Alternative methods of mapping monitoring data to populations (eg. geostatistical methods) • Update baseline air quality data • Alternative status quo air quality (don’t just assume constant) • Alternative population projections (allow different assumptions about birth rate, mortality rate, immigration and internal migration) • Update to 2001 census • Update risk coefficients • Derive risk coefficients more systematically • Allow risk coefficients to differ by geographic area • Allow baseline morbidity, mortality rates to differ by geographic area • Allow non-linearity in concentration response • Permit multi-year analysis • More flexible approach to uncertainty analysis (not just discrete three point distributions) • Alternatives to $ valuation (eg. QALYs)
ICAP • Ontario version released in 2000 • Expanded nationally • Peer reviewed • Currently being updated
Includes database of concentration response functions, valuations • Peer reviewed • Available online
Key points • Reduced (increased) air pollution results in health and environmental benefits (damages) • Alternative approaches to representing weight of evidence, uncertainty • Improved health (and environmental quality) have value to society • Variety of tools available to assess benefits
Damages • Burden on society from negative effects of air pollution • Benefits • Gain to society from reducing negative effects of air pollution
120 118 116 114 HealthOutcome 112 110 108 20 30 40 50 60 70 80 90 Air Pollution How do we quantify the impact of reduced (increased) exposure?
Monetary Valuation • AKA • monetization • assigning a monetary value to a change in health status • most appropriately measured as willingness to pay to improve health or willingness to accept compensation to worsen it
Unseemly Valuation implicit in innumerable private and public decisions Either do it implicitly or explicitly, but can’t avoid it Balances singular focus on industry compliance costs Image Problem - I
Simply asking people their preferences is too hypothetical Considerable effort in developing valid and reliable measures Reality checks Image Problem - II
Lives worth more in rich countries Distributional/ equity issues can be taken into account Image Problem - III
Perfect health (score of 1) 1 QALY = 1 year x score of 0.8 0.8 QALY = 1 year x Perfect health 0.8 QALY = 0.8 year x Quality/ Disability Adjusted Life Years Quality Adjusted Life Years (QALYs) Time (years) Quality of Life (0-1 scale) = x OR
Shortcomings • People like QALYs/DALYs because simple, intuitive • Huge following in clinical/ public health domain • BUT… • Some economists hate QALYs/ DALYs • Don’t measure what they purport to measure (people’s preferences among health states) • Ethical concerns • Discriminates against elderly, disabled • Big question left unanswered: • - how much should we spend to gain 1 QALY • - $40,000 (?) see also Harvard Cost-utility Analysis Database
1991 1992 1993 1994 1995 1996 1997 1998
Sulfate and Quality Adjusted Life Expectancy • Risk functions by age, sex, education, from re-analysis of ACS cohort • Applied to population of Canada over lifespan • Change in life expectancy estimated • Quality adjustment based on health utilities index from NPHS
Risk coefficients from American Cancer Society cohort study applied to Canadian life tables • Quality of life ratings from National Population Health Survey (Health Utilities Index) • Substantial impact of sulfate on quality adjusted life expectancy • Investment of over $1 billion/yr. would be warranted if it reduced sulfate concentrations by 1 µ g/m3.