Download

1 / 20
200 likes | 297 Views
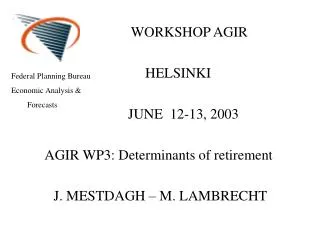
Federal Planning Bureau Economic Analysis & Forecasts. WORKSHOP AGIR HELSINKI JUNE 12-13, 2003 RESULTS FOR BELGIUM: WP1 – WP2 J. MESTDAGH – M. LAMBRECHT. WP 1 Biodemographic aspects of ageing.

E N D
Federal Planning Bureau Economic Analysis & Forecasts WORKSHOP AGIR HELSINKI JUNE 12-13, 2003 RESULTS FOR BELGIUM: WP1 – WP2 J. MESTDAGH – M. LAMBRECHT
WP 1 Biodemographic aspects of ageing Paper presented in The Hague, 14-15/2/2003: • Population: evolution, structure by age and by gender • Fertility: number of births, birth rate • Mortality, probabilities of death, survivors • Longevity : LE, modal + median life duration, life endurance record age
WP 1 Biodemographic aspects of ageing (2) • Life courses : age to leave school, marriage, children, retirement and widowhood • Morbidity: health and disability (vision and hearing problems, mental health, mobility) • Healthy and disability free life expectancy
WP1 – Results Belgium Additional information gathered since AGIR meeting in The Hague, February 14-15 • Number of births by gender 1950 - 2050 • Age at first job
Fertility Number of births by gender, 1948 – 2000 • Decrease in the number of births (150.000 in 1948 and 114.800 in 2000) • More boys than girls
Fertility (2) Number of births by gender, 2000 – 2050 Varies between 115.000 and 108.000 babies
Age at first job Average age at first job, 1990 – 2000, men and women (irrespective whether still doing this job or not) • Increase in age at first job from 20 in 1990 to 24 in 2000 (note: age at which people leave school increased from 19.9 to 21.5 in the same period)
WP2 – Use of health care and nursing by the elderly Paper presented at The Hague, 14-15/2/2003 • Demand for (use of) health care • Hospital admissions • Length of hospital stay c) Contacts with doctor (average number) • Demand for (use of) long term care at home and in institutions
WP2 – Use of health care and nursing by the elderly • Supply of ‘formal’ health care: doctors, nurses, hospital beds… • Supply of ‘informal’ health care: a) Household composition b) Labour market developments: participation rates, PT employment, working hours…
WP2 – Results Belgium Additional information gathered since AGIR meeting in The Hague, February 14-15 • Hospital admissions • Length of hospital stay • Contacts with a doctor (% of population) • Household composition by age group and gender
Hospital admissions Average number of admissions, 2000, by age and gender • Highest at age 0, then decrease, to increase again with age • Women are less frequently admitted except at age 15-34
Hospital admissions (2) Average number of admissions – 1991 – 2000, by gender / age • Increase between 1991-’00 for younger and older age groups • Decrease between 1991-’00 between age 1 and 45
Length of hospital stay Average length of hospital stay by age group and gender, 2000 • Positive relation with age : increases as people get older • Higher for women than for men, especially in oldest age group
Length of hospital stay (2) Average length of hospital stay by age group / gender, 1991-00 Decrease between 1991-2000, men/women, all age groups
Volume of hospital stay Volume of hospital stay, 2000, by gender and age • U-shaped curve, positive relation with age • Similar for men and women (except age 15-34)
Volume of hospital stay (2) Volume of hospital stay, MEN, by age , 1991 – 2000 Slight decrease between 1991 and 2000, all ages except youngest age group
Volume of hospital stay (3) Volume of hospital stay, WOMEN, by age, 1991 – 2000 Slight decrease between 1991 and 1998, all ages except youngest age group
Contacts with doctor % of population having contact with doctor during past year, by gender and age, 2001 • Increase with age (avg. # of contacts increases with age too) • More women contact their doctor than men do (except in youngest age group)
Household composition % of MEN in single HH, 1991-2001, by age group • % increases with age • % decreased between 1991 and 2001
Household composition (2) % of WOMEN in single HH, 1991-2001, by age group • % increases with age, except in oldest age group • % decreased between 1991 and 2001