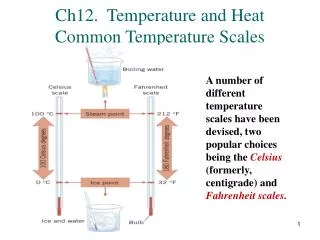
HEAT & TEMPERATURE
HEAT & TEMPERATURE. Temperature Scales. Heat Transfer and Warming. What happens to the heat?. Where does the heat go?. It’s the Ocean!!!. Heat Capacity. Heat capacity is the amount of heat required to change an object’s temperature


HEAT & TEMPERATURE
E N D
Presentation Transcript
What happens to the heat?
Where does the heat go? It’s the Ocean!!!
Heat Capacity • Heat capacity is the amount of heat required to change an object’s temperature • The oceans have 1000 x the heat capacity of the atmosphere The Oceans are Earth’s heat capacitors
Earth Warms Energy Balance A New Balance Atmosphere Atmosphere A Warmer World
Earth Warms Energy Balance:The Ocean Planet This takes 1000 years!!!
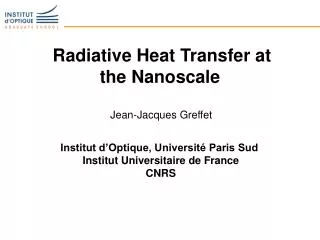
Heat Transfer • Conduction • Molecule-to-molecule transfer • Convection • Energy transferred by movement • Advection • Horizontally dominant movement • Radiation • Energy traveling through air or space
Heat Transfer Figure 3.7
Distribution of Net Radiation: R-Net Radiation H-Sensible Heat LE-Latent Heat G-Ground Storage Bowen Ratio= H/LE
Daily Radiation Patterns Figure 3.12
Principal Temperature Controls • Latitude • Affects insolation (daylength, intensity) • Altitude • High altitude has greater daily range • High altitude has lower annual average • Cloud Cover • High albedo • Moderate temperatures – cooler days, warmer nights • Surface Characteristics- albedo, aspect
Effects of Latitude Figure 3.17
Altitude Figure 3.18
Land–Water Heating Differences Figure 3.20
Urban Heat Island Figure 3.30
Causes of the Urban Heat Island: 1. increased RL↓ due to absorption of outgoing RL and re-emission by pollution. 2. decreased net RL↑ loss from canyons due to reduction in sky-view factor (SVF) by buildings. 3. greater shortwave radiation absorbed due to effect of canyon geometry on albedo. 4. greater day heat storage due to thermal properties of urban materials and its nocturnal release. 5. anthropogenic heat (QF) from building sides. 6. decreased evaporation (QE) due to removal of vegetation and surface ‘water proofing’ of city. 7. decreased loss of sensible heat (H) due to reduced winds in canopy.
Photograph (left) and thermal image (right) of a dense residential neighbourhood in Tokyo Japan. The skyline of the Shinjuku area of Tokyo is visible in the background. The thermal image was taken in early October during the late afternoon as the urban surface began to cool. The photograph was taken on a different day and is courtesy of M. Roth (National University of Singapore).